(A. Le Bail, 2020-2023)


The paper does not contain interatomic distances, only angles. But if you calculate them, they are quite funny... :
Bi1
Bi2
1.4197
Bi1
Bi1
1.2644
Bi1
Ca
2.1225
Bi2
O4
2.1780
Bi2
Ca
1.0756
Bi2
O4
2.0608
Ca
O4
2.0023
Mg
O2
1.5170
Mg
O1
1.5183
Mg
O3
2(3)
Mg
O3
1(3)
O2
O3
1(4)
O2
O2
1.6404
In 1985 I presented my PhD thesis entitled "Structure of fluoride glasses of 3d transition elements"
It contains a lot of fluoride glasses studied by EXAFS, neutron and X-ray diffraction, modelling by a RDM approach (Rietveld for Disordered Materials)
Many papers were published (synthesis : 1983; EXAFS : 1984 , 1985, 1986; neutron and X-ray diffraction : 1982, 1983, 1985a, 1985b, 1985c ; modelisation by a Rietveld approach : 1985a, 1985b, 1987, 1988, 1995 (SiO2).
Then the RMC (Reverse Monte Carlo) method for modelling glass structures was published and I applied it to some of these fluoride glasses, comparing the results to RDM, and even combining RMC and RDM: 2000 ; and also to other amorphous compounds : 2000, 2001.
The last RMC study I made was concerning the BaMn(Fe/V)F7 fluoride glasses. The results were presented in 2003 during the CONCIM conference and a paper was prepared but deposited only in ArXiv. Why not finally publishing it in the Journal of Non-Crystalline solids as it was done for NaPbM2F9 fluoride glasses in 2000 ? Well I was tired of all these modellings and changing my research interests...
Much later, in 2023 I realized that this 2003 conference paper was cited in a few papers published by a research team at the Tlemcen University (Algeria) and even in a PhD thesis. I am retired since 2016 but still curious and I examined the papers and the thesis...
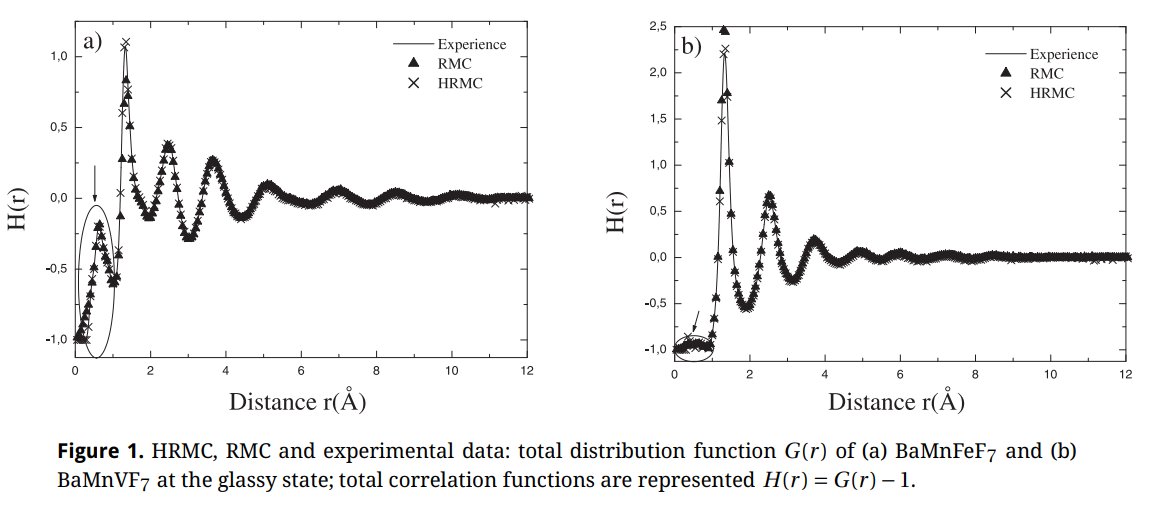
In the first paper from Tlemcen (2013) I could recognized immediately my own neutron diffraction data about the BaMn(Fe/V)F7 glasses first studied in my 1985 PhD thesis and reused by me in 2003 for RMC and RDM structure modelling. However, if the curves were the same, the scale was changed from Q(A-1) into R(A). The structure factors F(Q) were transformed into radial distribution functions G(R) without any Fourier transformation, just a renaming !
Figure 1 in their 2013 paper :
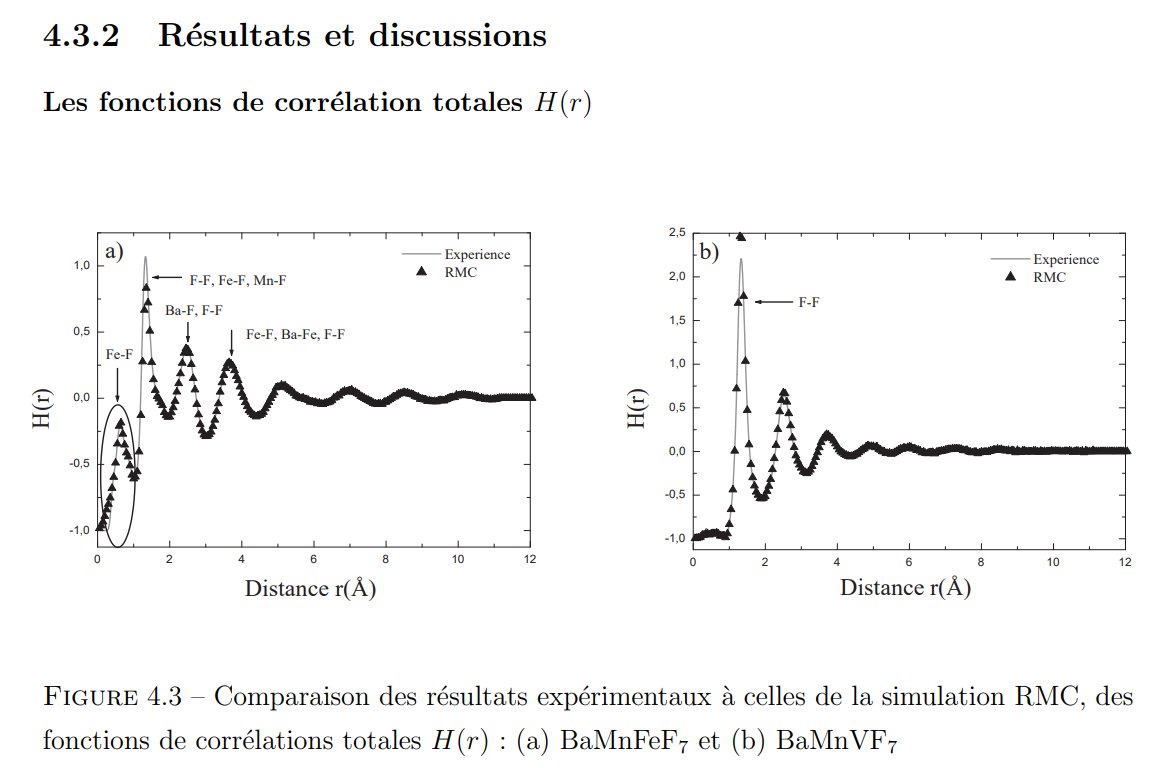
Again in their 2015 paper, Figure 1 :
Or in the Mesli 2013 thesis :
Compare to the original data either in my 2003 conference or in my 1985 thesis :
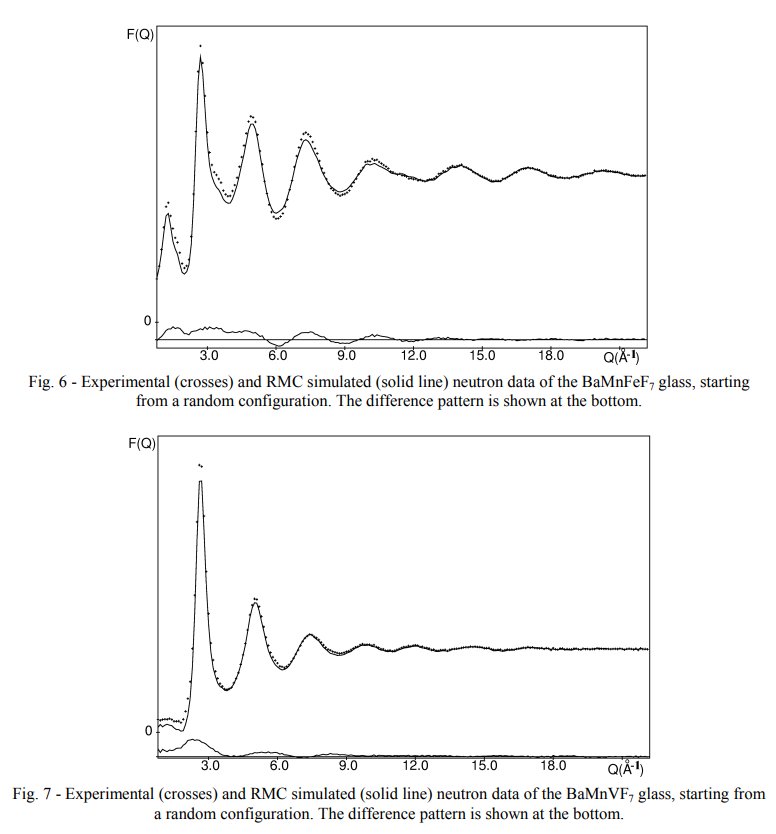
In my 2003 conference were shown the interference function only, several times when comparing the original experimental neutron data with the calculated ones from various structural models, here figs 6 and 7 in the ArXiv deposited paper in 2003 :
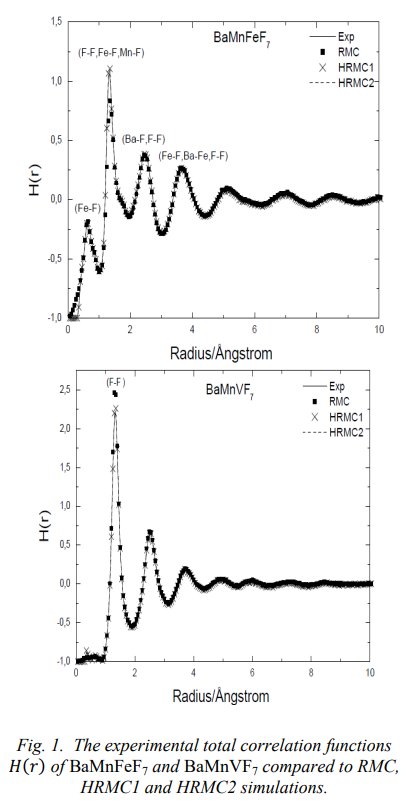
In my thesis, page 79, are the full series of BaMIIMIIIF7 glasses, including the BaMnFeF7 and BaMnVF7 ones with both the interference functions S(Q) on the left and their corresponding radial distribution functions G(R) on the right :
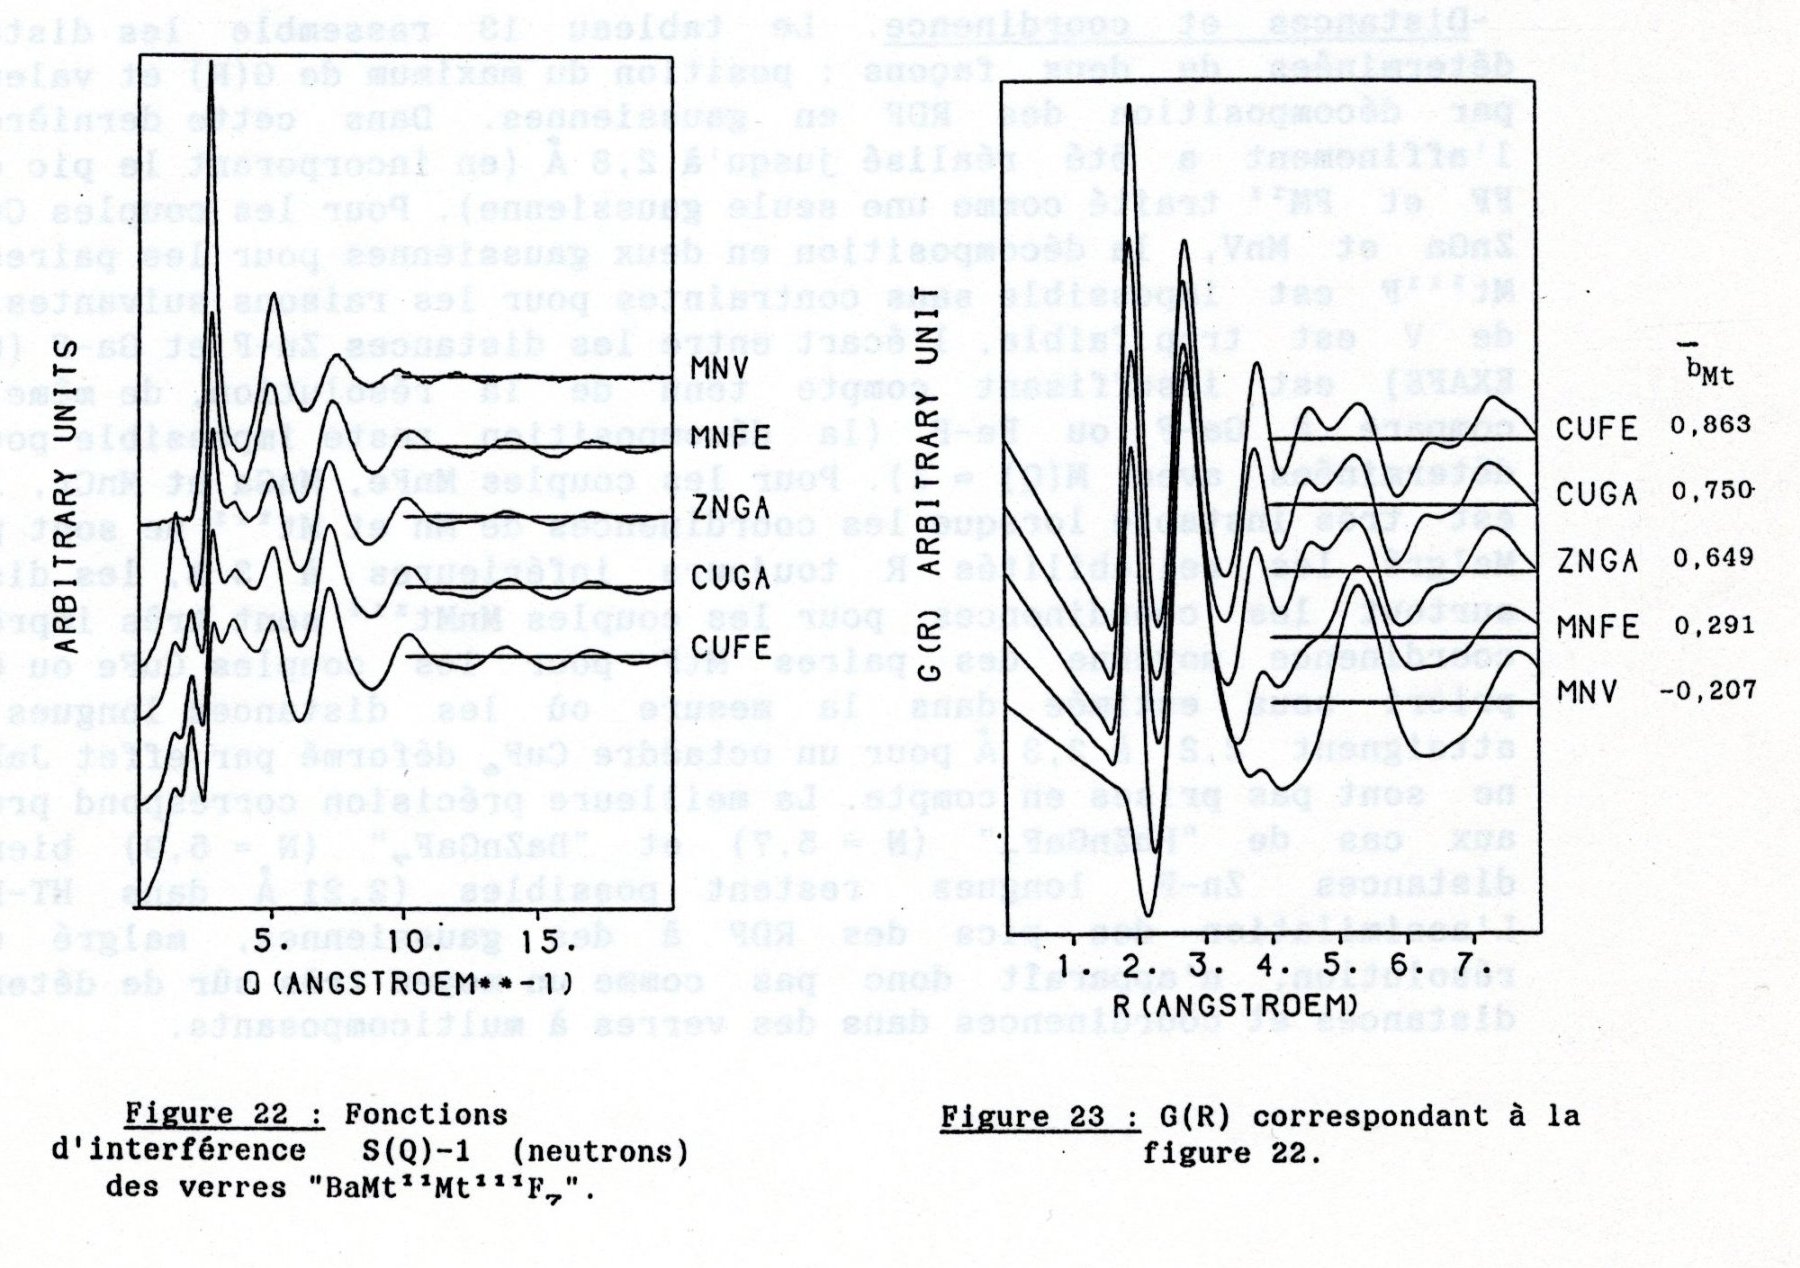
Clear that the G(R) in my thesis are not corresponding to the G(R) in the Mesli thesis or in his 2013 and 2015 papers. The Mesli G(R) are my interference functions S(Q) !!!
Same oddities in their 2021 paper, impossible inter-atomic distances, since they try to fit G(R) functions which are in fact S(Q) functions ! BTW, they never show a picture of their RMC modelling results, they show only my pictures dated from 2003...
So we are here in presence of a plagiat of two figures serving as starting point of a flawed study since the meaning of the two figures was falsified, changing the Q scale into a R scale with arbitrary values. Letting Fe-F distances shorter than 1 angstrom indicate a full incompetency in Chemistry and Physics for all persons in presence during the thesis sustaining and refereing the papers.
See the comments at PubPeer :
https://pubpeer.com/publications/3837C565C836A452AC77BAF98B30F1
https://pubpeer.com/publications/501B561FF3980FC69C34B9A8B80CCE
Comments sent to the editors of the 2013 Mesli et al. paper :
=====================================================================================================
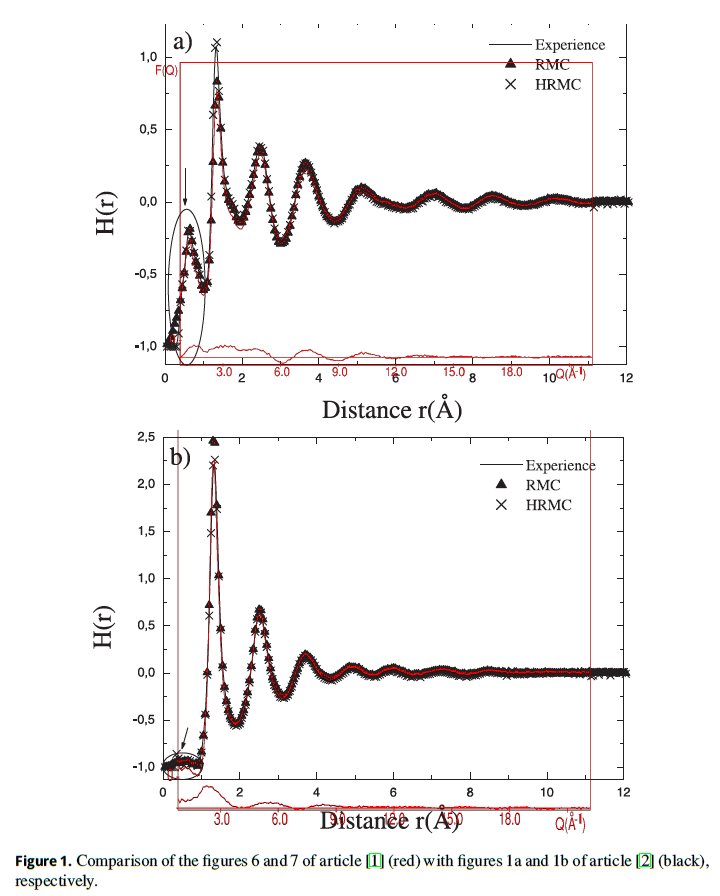
In figure 1, we have superimposed figures 6 and 7 of article by Le Bail [1] for the structure factor 𝑆(𝑄) of BaMnFeF7 and BaMnVF7 glasses as functions of momentum 𝑄 in units of Å−1 (red crosses and lines) on top of the figures 1a and 1b, respectively, of article by Mesli et al. [2] for the total correlation functions (binary distribution functions) 𝐻(𝑟) = 𝐺(𝑟) − 1 as functions of interatomic distance 𝑟 in units of Å. The horizontal scales are matched by matching ticks at 𝑄 = 6 Å−1 and 𝑟 = 3 Å, and at 𝑄 = 18 Å−1 and 𝑟 = 9 Å, respectively. The vertical scales are adjusted for the best fitting.
The total correlation function was calculated in [2] using Reverse Monte Carlo (RMC) method by selecting only such configurations of atoms that minimize the mean-square deviation 𝜒2 (2.3) from the experimental data points. As a result, the black triangles of the RMC results exactly coincide with red crosses of the fitted experimental data of [1]. Unfortunately, for the unknown reasons, Mesli et al. [2] were minimizing the difference 𝜒2 between the quantities of different physical meaning: the total correlation function 𝐻(𝑟) = 𝐺(𝑟) − 1 and the total scattering structure factor 𝑆(𝑄). That means, that the wrong configurations of atoms were selected during the RMC steps and the obtained three-dimensional structural model is not applicable to the experimental data, which makes other obtained results dubious.
Besides, Mesli et al. [2] have cited article by Le Bail [1] in the Introduction but did not provide any citation in the caption to figure 1, which violates the general requirements to provide credits to the sources of data and figures itself in the captions of figures.
References
1. Le Bail A., Reverse Monte Carlo and Rietveld modelling of BaMn(Fe,V)F7 glass structures from neutron data, 2003, doi:10.48550/arXiv.cond-mat/0310487, Preprint arXiv:cond-mat/0310487.
2. Mesli S. M., Habchi M., Kotbi M., Xu H., Condens. Matter Phys., 2013, 16, No. 1, 13602, doi:10.5488/CMP.16.13602.
===========================================================================================
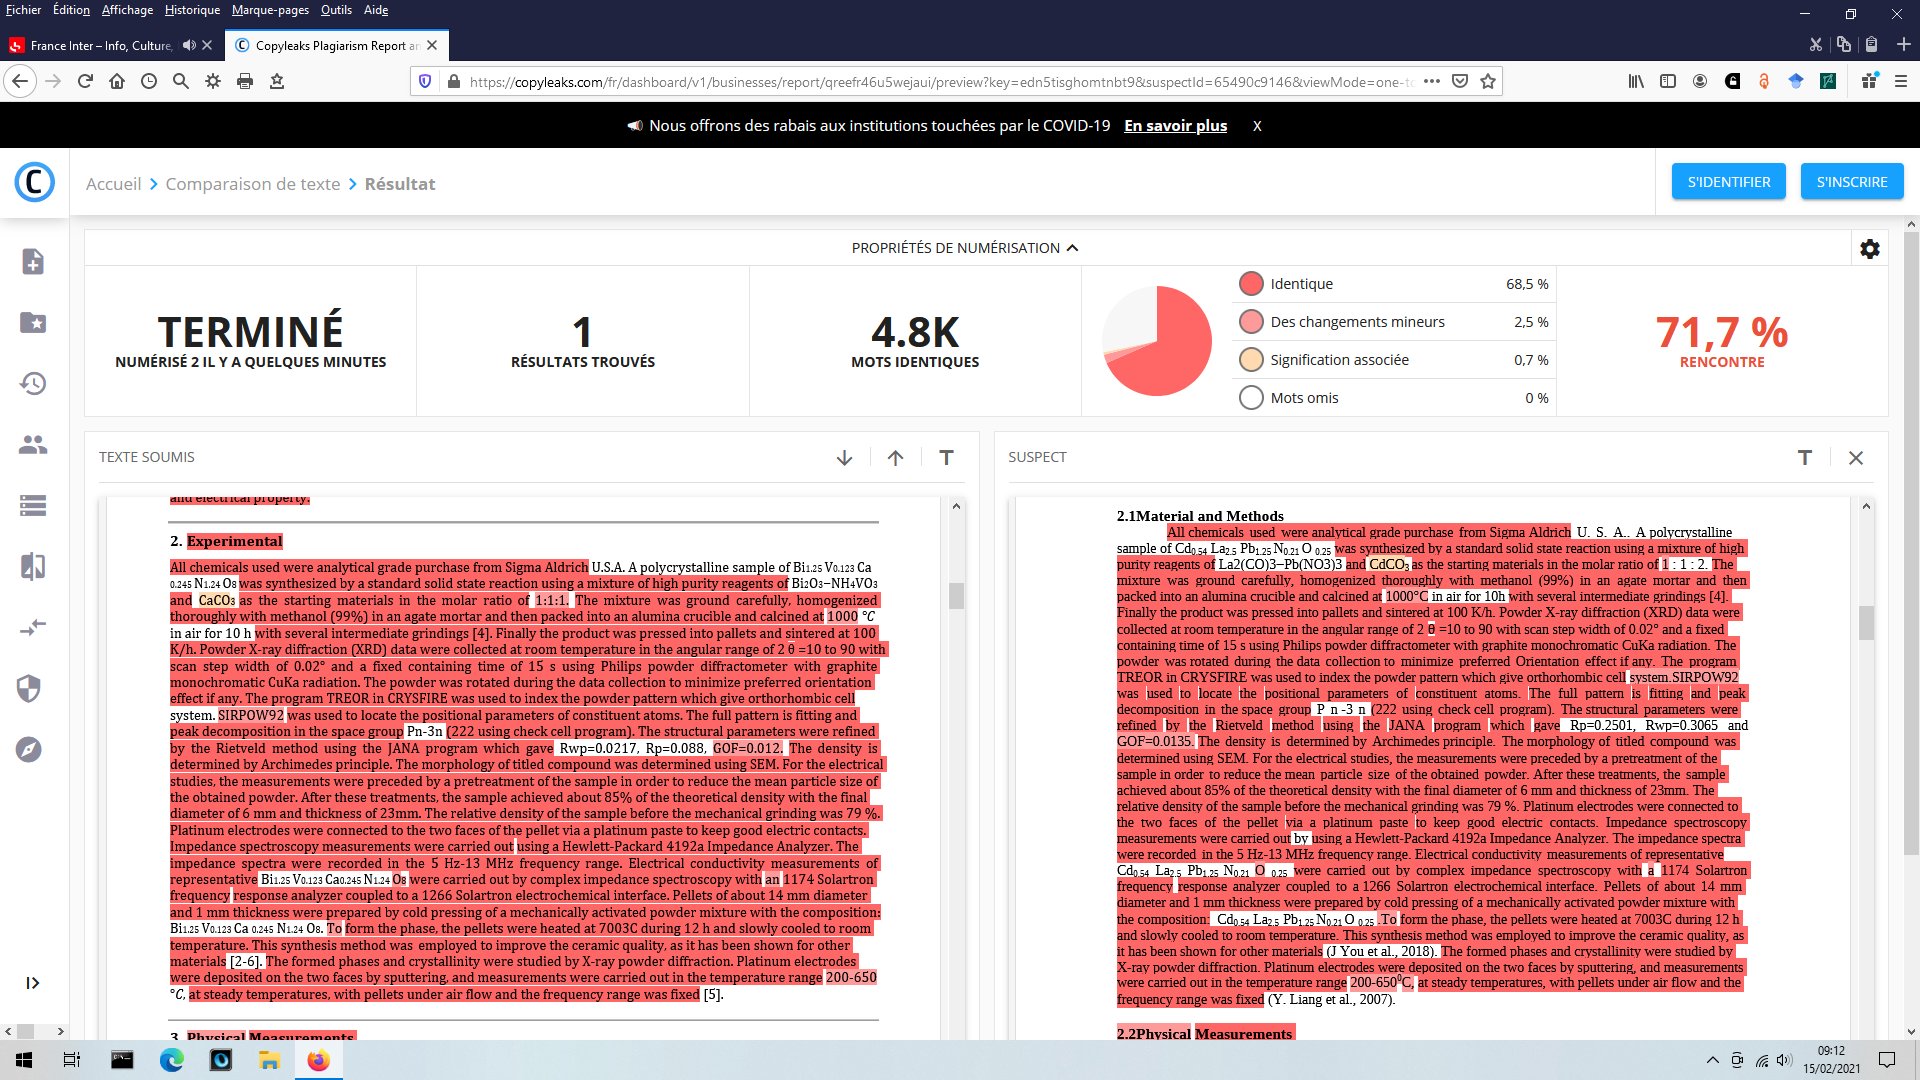
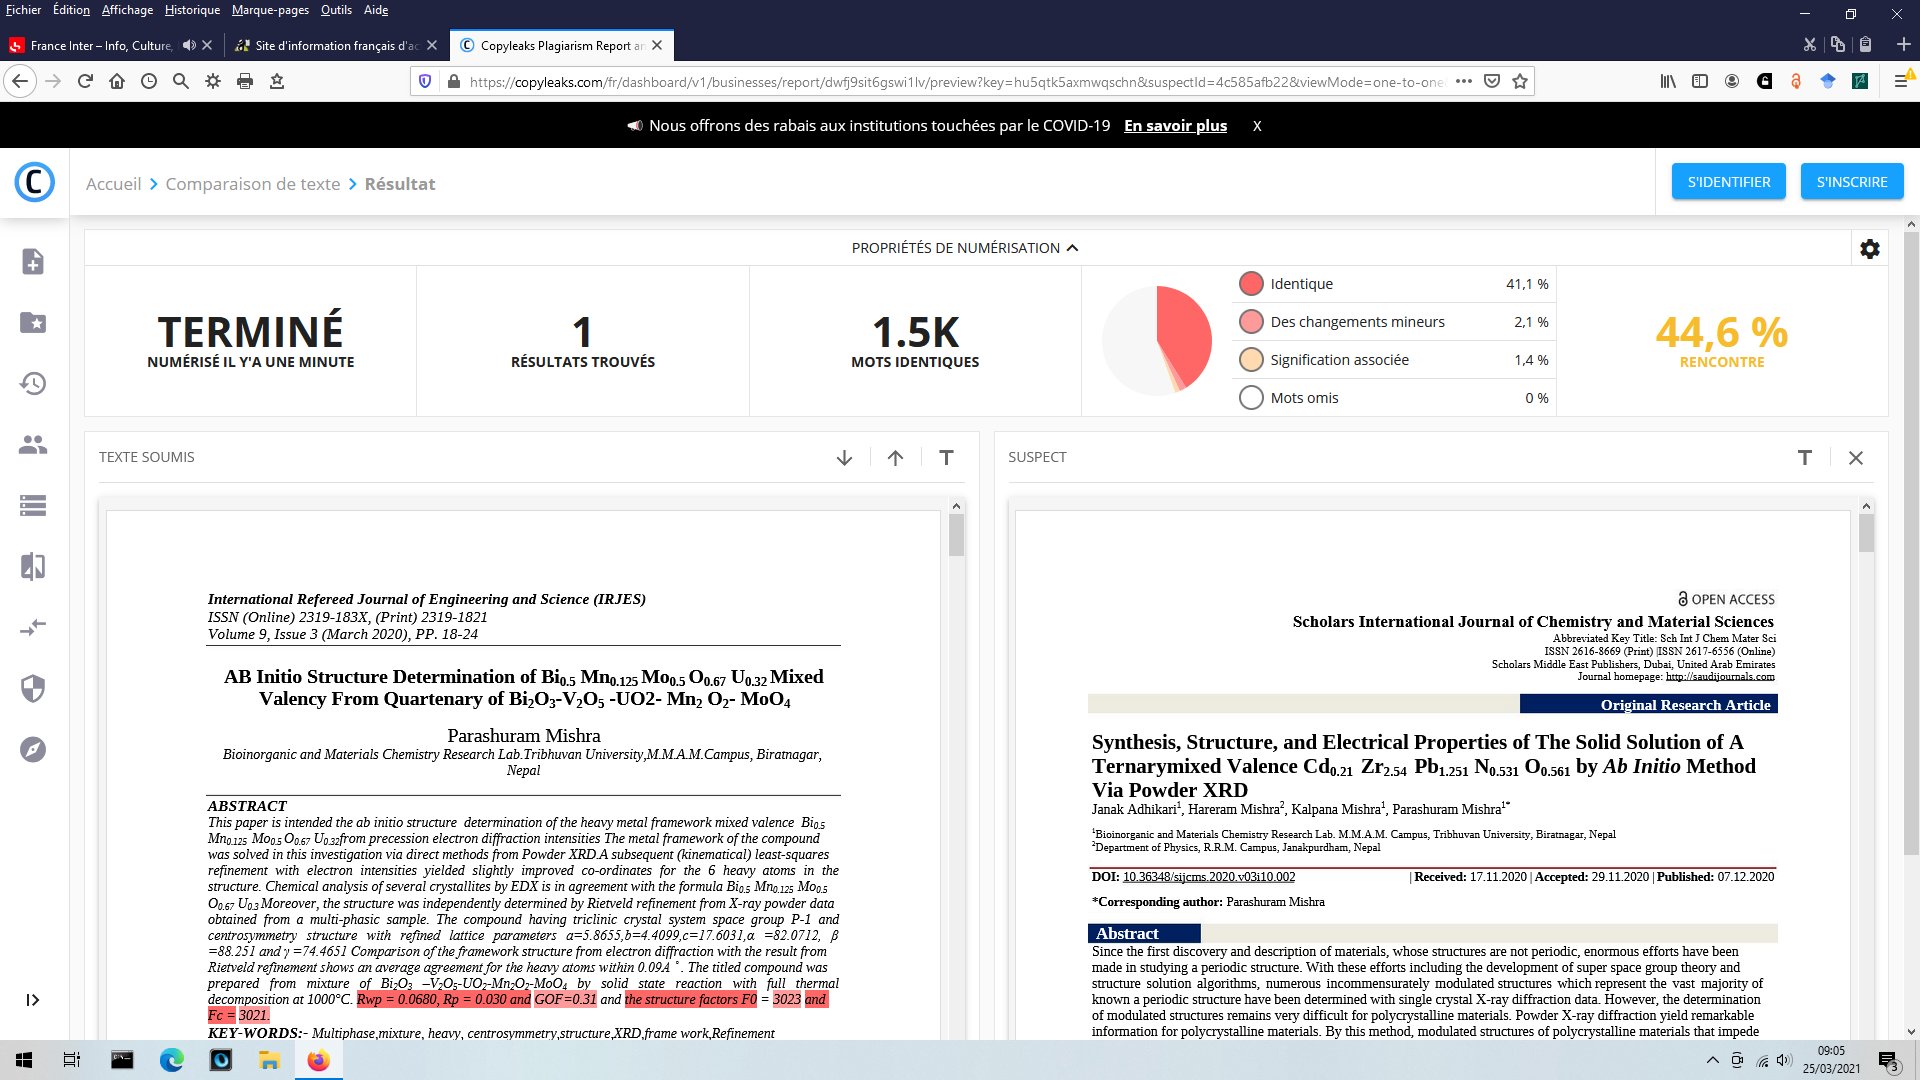
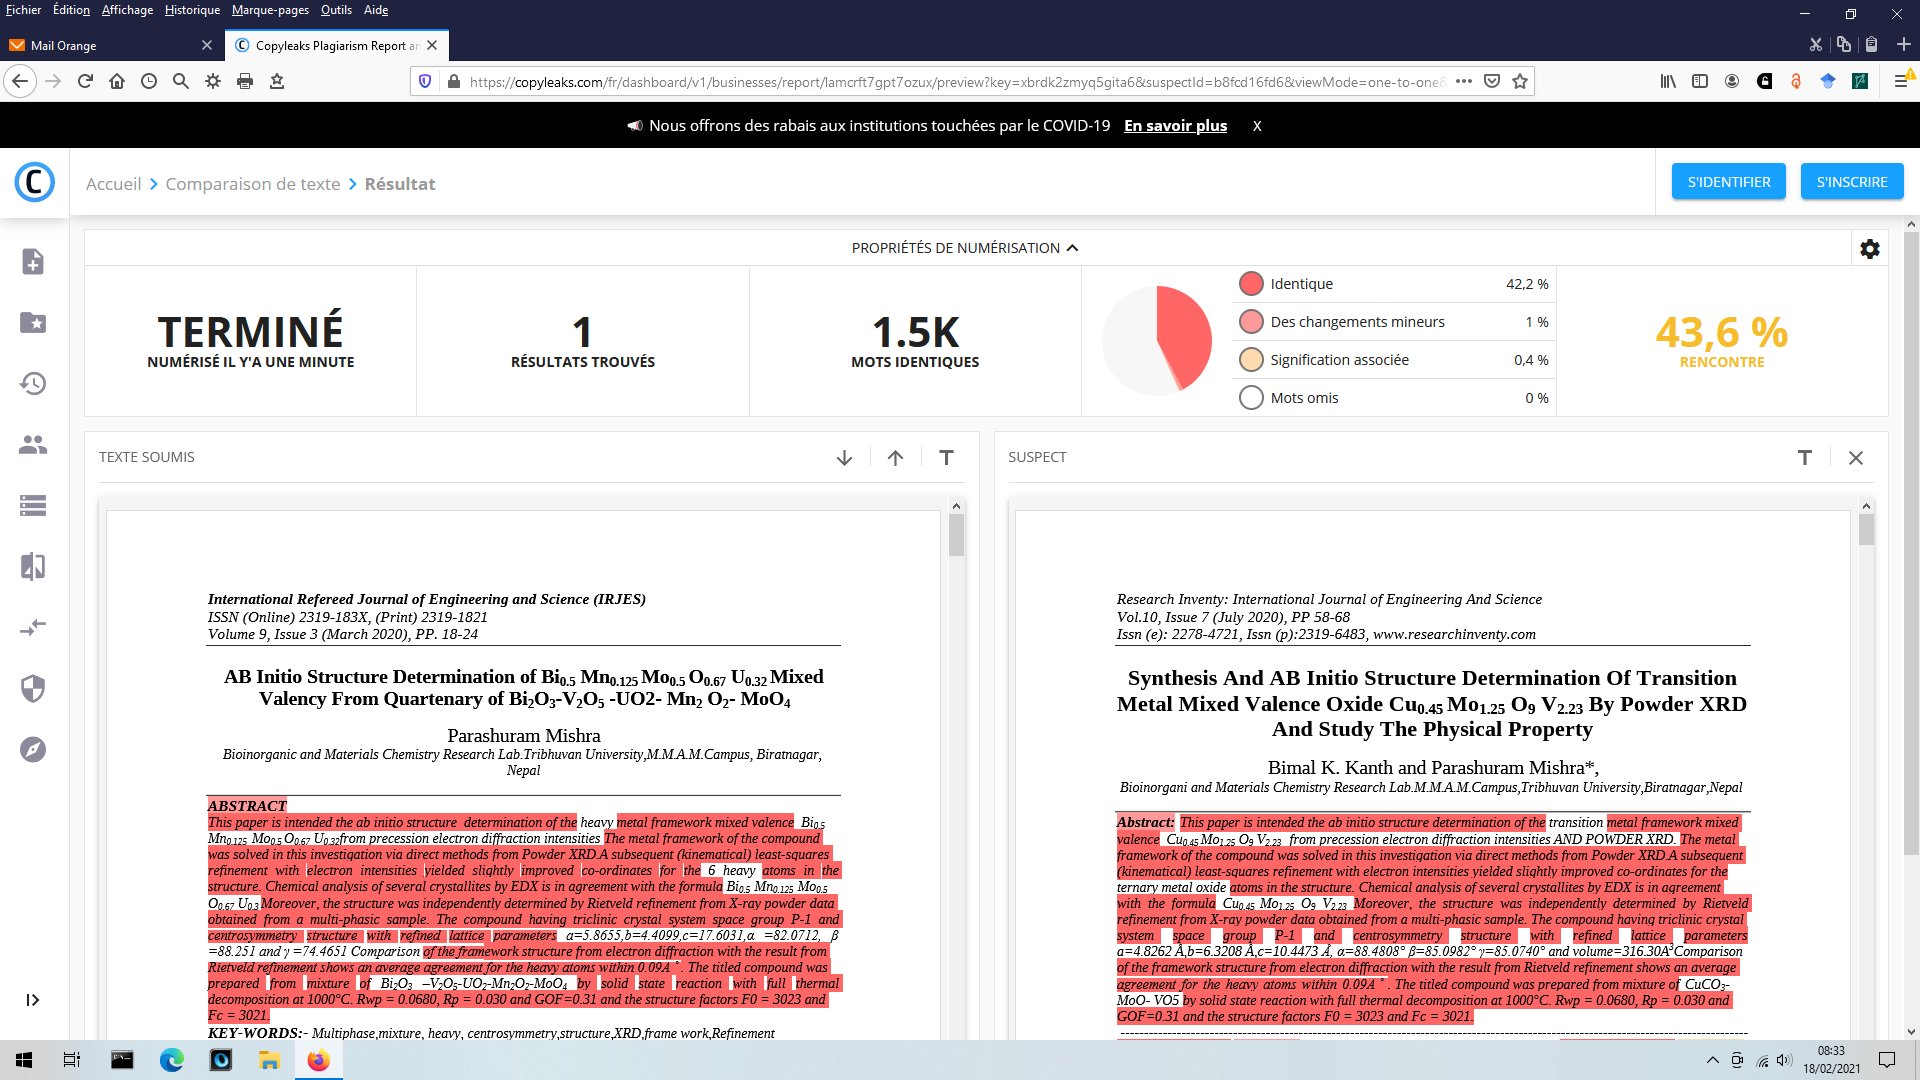
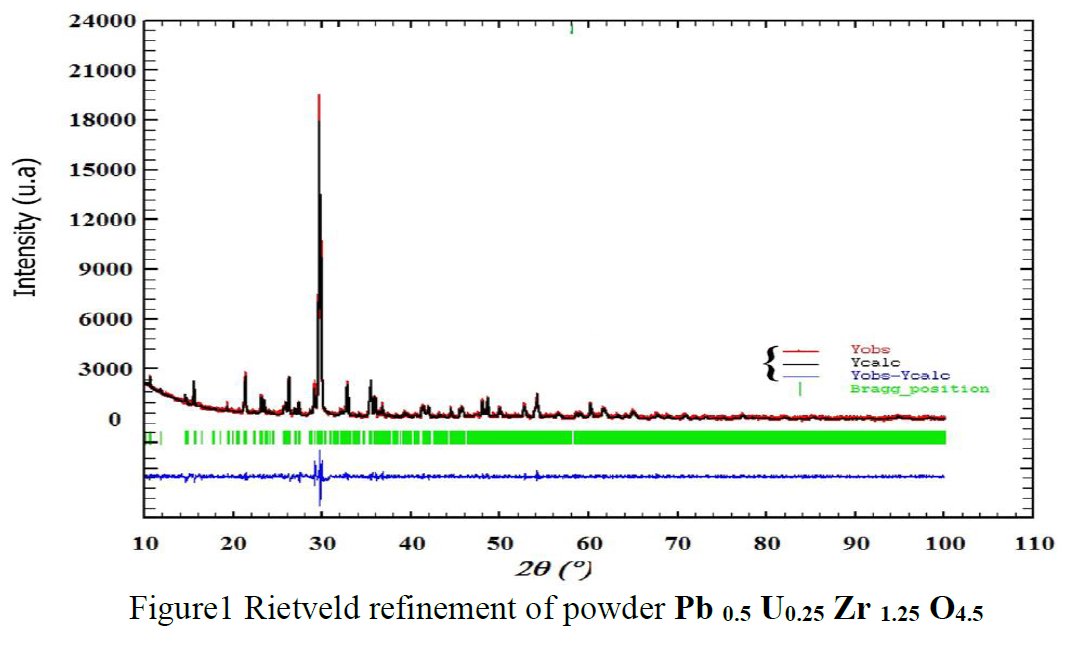
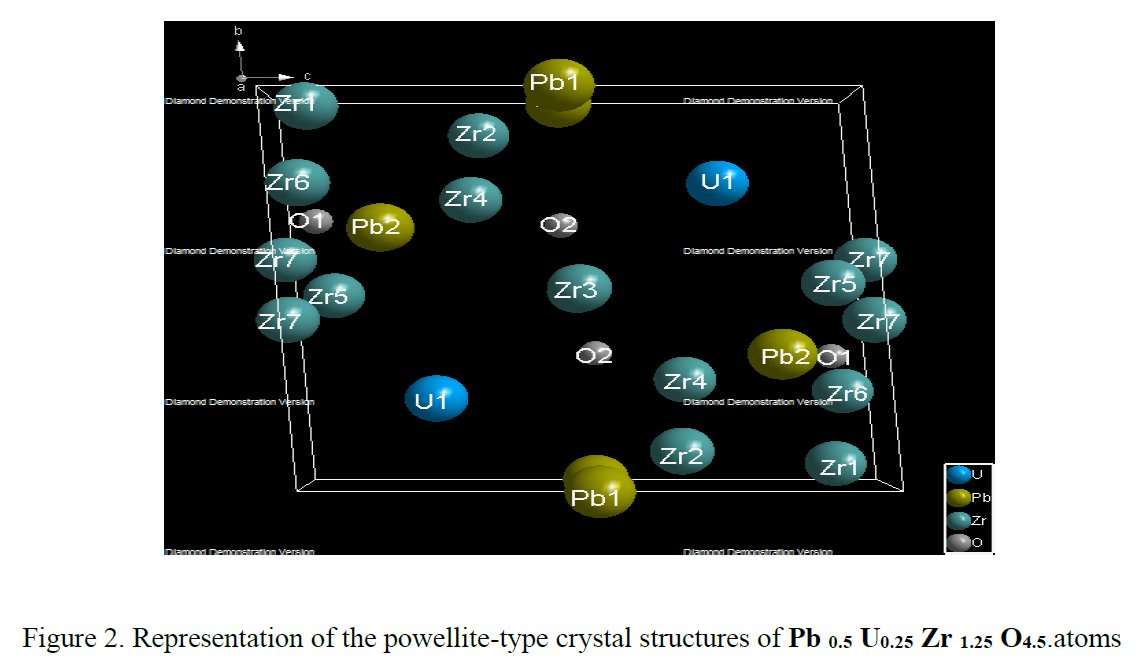
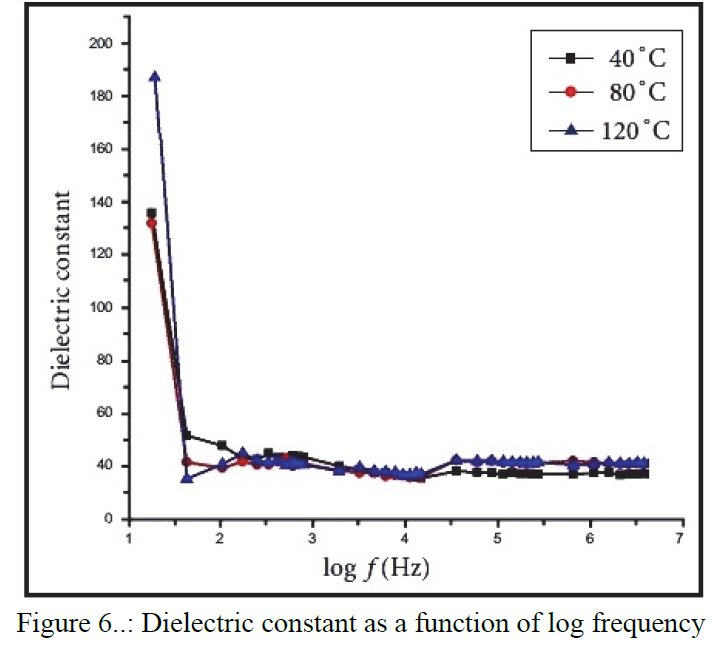
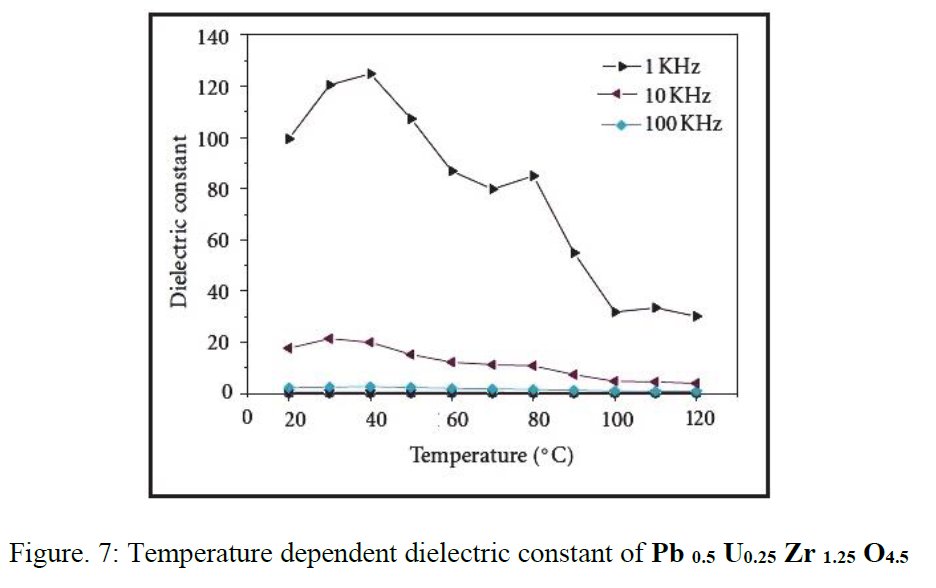
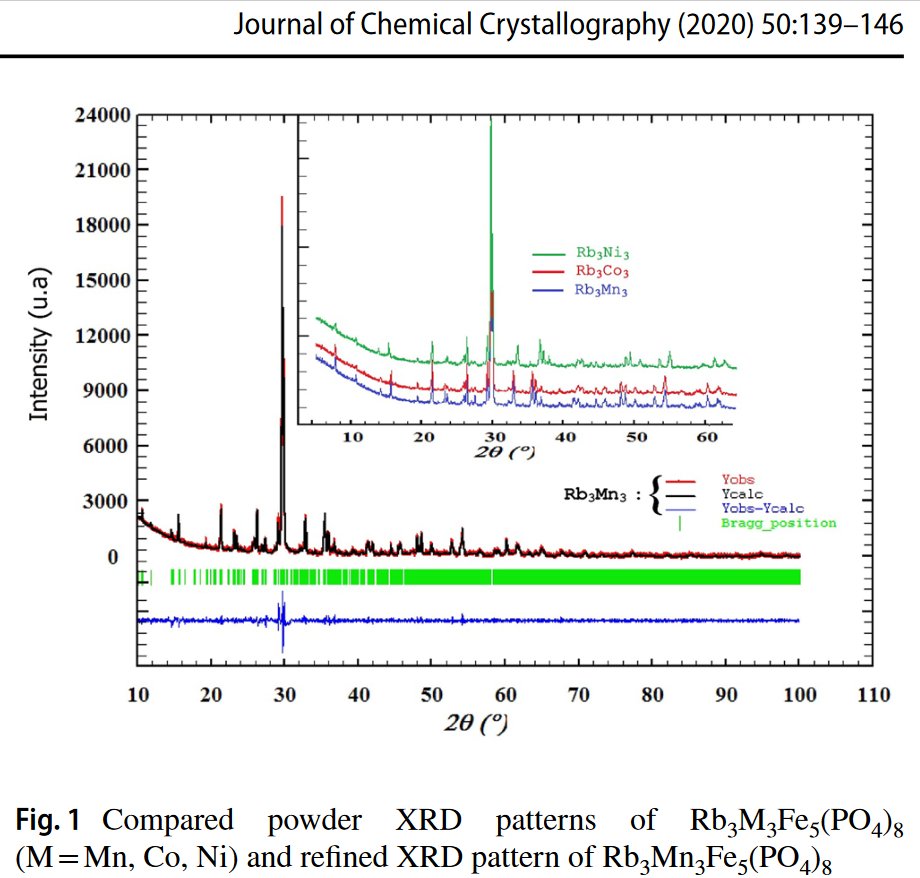
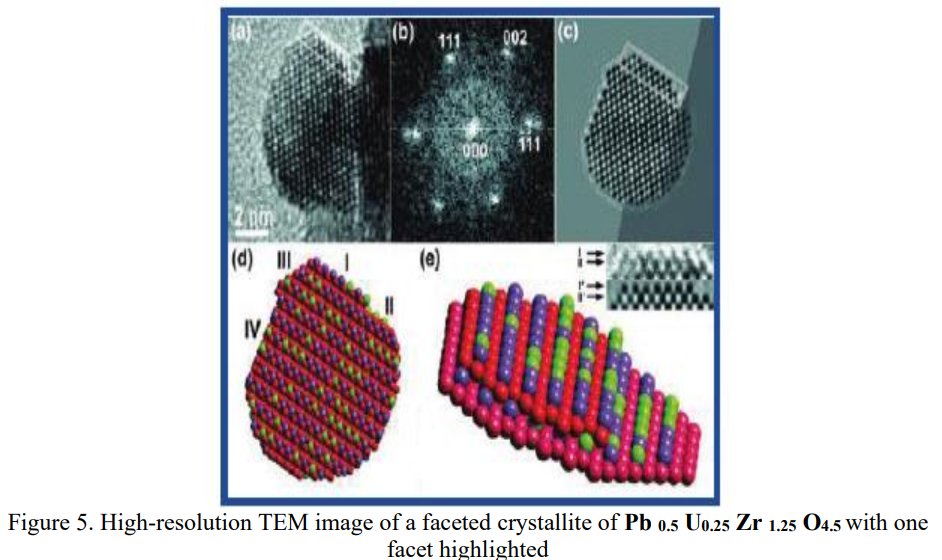
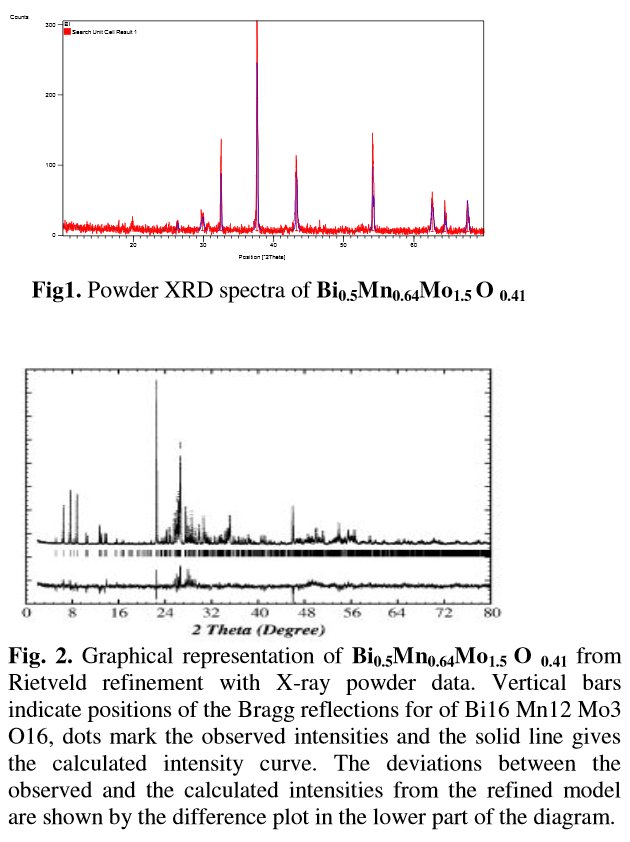
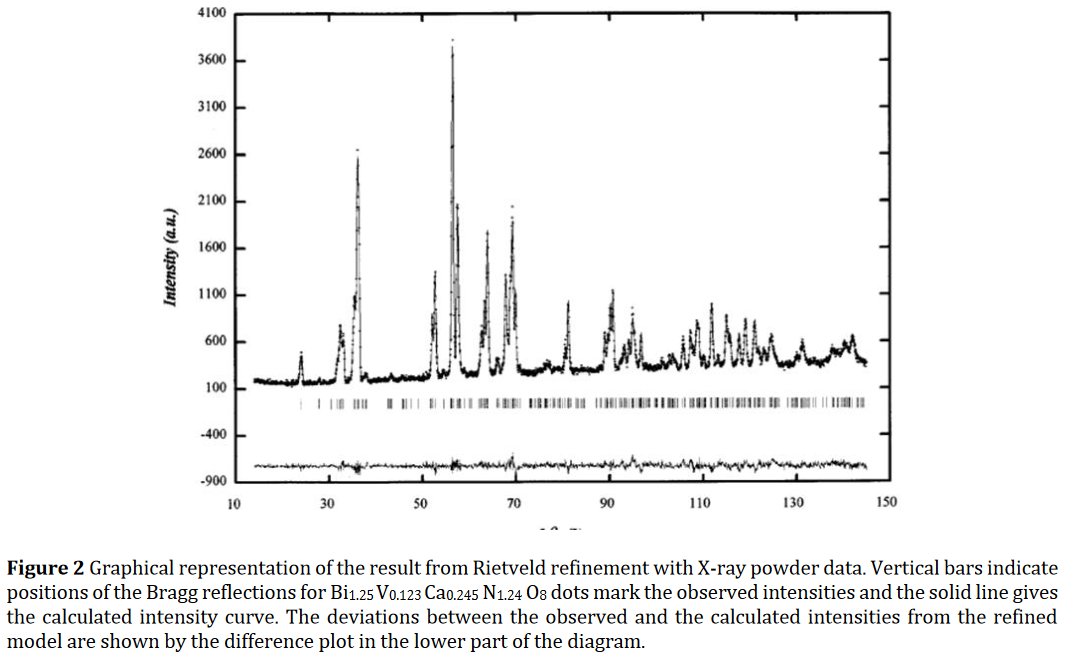
As a researcher concerned by his own work I receive alerts from Google Scholar when my papers are cited by other researchers. That time, the paper citing me had the title « Synthesis and structure determination of novel mixed valence Pb 0.5U0.25Zr1.25O4.5 by powder XRD obtained from PbCO3-U(CO3)Zr(CO3)2 ternary mixed valence oxides. » [1] The methodology (XRD, Rietveld method) being my main specialty this was enough for me to have a look inside of the paper which was in open access at ResearchGate. It was a kind of shock. The triclinic crystal structure described in the abstract has two cell parameters less than 2 Å (a = 1.855 Å, b = 1.1937 Å, c = 8.8785 Å, α = 90.1230°, β = 94.2069°, γ = 91.2743°) though in Table 1 only one parameter stayed below 2 Å and changed occured also on the angles (a = 1.855 Å, b = 8.1937 Å, c = 8.8785 Å, α = 94.2069°, β = 91.2574°, γ = 91.7243°) ! The Rietveld fit looked nice on Fig. 1, indexing was said to be obtained with the help of TREOR in the CRYSFIRE software, giving an orthorhombic cell (so, not triclinic !), and SIRPOW92 was used to solve the structure (that software extracts the structure factors from the powder pattern by the Le Bail method and then applies Patterson and/or direct methods) in the Pcnb space group. The final Rietveld refinement was said to be performed by using GSAS though surprisingly the Rietveld plot drawing was characteristic of the use of FULPROF/WINPLOTR. Later in the text, the story is changing completely and it is said « The initial structure model was obtained using a charge flipping algorithm with the program Superflip.8. Random phases were used at the beginning of the charge-flipping iteration, and overlapping peaks were re-partitioned using a histogram match to improve the convergence. The iteration converged with an R factor of 29% and the final electron density shows a P-1 symmetry with a 5% error. The program of EDMA was then used to automatically assign atomic positions. Four unique heavy atomic positions were found and the heaviest one was assigned as Zr while the others were considered as Zr and U. Due to the existence of heavy atoms, all oxygen positions were ambiguous in the electron density map of this stage. To locate the oxygen atoms, a Monte-Carlo based simulated annealing process with the program TOPAS was applied. For each annealing process, various atomic coordinates were randomly assigned as the initial positions of the oxygen atoms. The annealing process was restarted after finding a few oxygen positions, until all oxygen positions were found to be reasonable. » For an expert in the field of SDPD (Structure Determination by Powder Diffractometry) all this is completely foolish. Adding the fact that we have all these atoms at less than 2 Å from each others, including Uranium, and that there is no charge equilibrium in the chemical formula (6+ and 9-), then this was enough for me and I sent a comment to the author through the ResearchGate system where I saw that many other papers of that kind were listed.
8 October 2020 comment : « You are crazy... A cell parameters as short as 1.855 Å implies that all atoms have a same type atom neighbour at 1.855 Å apart. So, Pb-Pb = Zr-Zr = O-O = U-U = 1.855 Å ! Well, you should stop pretending being an expert in structure determination from powder diffraction data. I suggest you an immediate retirement. Shame on you ! »
There was an answer from Kristian Sugiyarto :
« I think we only be able to identify the suitable space group, then cell parameters. If you have crystal structure from single crystal you may compare the parameters. That's all.
I want to get suggestion from Prof Le Bail, what R values (Rexp, Rp, Rwp, GOF, Bragg R factor) are allowed for considering an acceptable refinement? »
My answer was :
« Obtaining low R values is always possible if you do not care with the usual crystal chemistry, (classic interatomic distances) even with an incorrect cell and space group. This is the case here. The cell is false but you can obtain a good fit by adding a certain number of atoms at wrong positions... An acceptable refinement should first correspond to a structural model making sense. And U-U distances of 1.8 A is nonsense. I have proposed Parashuram Mishra as candidate for an IgNobel but with the hope that he will not be retained since his "crystal structure determinations" are just crazy due to incompetency. None would pass an examination by referees. The fact is that there is no peer review in predatory journals, then you can publish pure nonsense. »
https://www.researchgate.net/publication/344069973_SYNTHESIS_AND_STRUCTURE_DETERMINATION_OF_NOVEL_MIXED_VALENCE_Pb_05_U025_Zr_125_O45_BY_POWDER_XRD_OBTAINED_FROM_PbCO3_-UCO32_-ZrCO32_TERNARY_MIXED_VALENCE_OXIDES/comments
I obtained no reaction at all from the author himself. Then I started a public discussion on Twitter and various crystallography Facebook groups.
October 6, 2020
https://twitter.com/xtalb/status/1313392636355653635
« No-no-no, please do not deposit that into the COD : https://researchgate.net/profile/Parash »
October 8
https://twitter.com/xtalb/status/1314217082041622529
“An oxide with a cell parameter as short as 1.855 A ! This is what you can publish in predatory journals”
As soon as October 8, 2020, I wrote an email to the Tribhuvan University, M.M.A.M. Campus, Biratnagar, Nepal :
Jeudi, Octobre 08, 2020 17:22 CEST
From : Armel le Bail Armel.le_Bail@univ-lemans.fr
To : info@tu.edu.np
Hello,
An oxide with a cell parameter as short as 1.855 A ! This is what is
published in a predatory journal from a Prof. in your university. See :
https://www.researchgate.net/publication/344069973_SYNTHESIS_AND_STRUCTURE_DETERMINATION_OF_NOVEL_MIXED_VALENCE_Pb_05_U025_Zr_125_O45_BY_POWDER_XRD_OBTAINED_FROM_PbCO3_-UCO32_-ZrCO32_TERNARY_MIXED_VALENCE_OXIDES
This denotes full absence of competence... And there are several recent
papers as fool as that one !
See :
https://www.researchgate.net/profile/Parashuram_Mishra
Best wishes anyway.
Armel Le Bail
October 18 – that time this is a paper from Kristian Sugiyarto which is discussed at twitter :
https://twitter.com/xtalb/status/1317719063293054977
« Is it possible to get a nice whole powder pattern fit by either the Pawley or the Le Bail method starting from a large (and false) triclinic cell ? Yes.. http://pkim.pps.uny.ac.id/sites/pkim.pps »
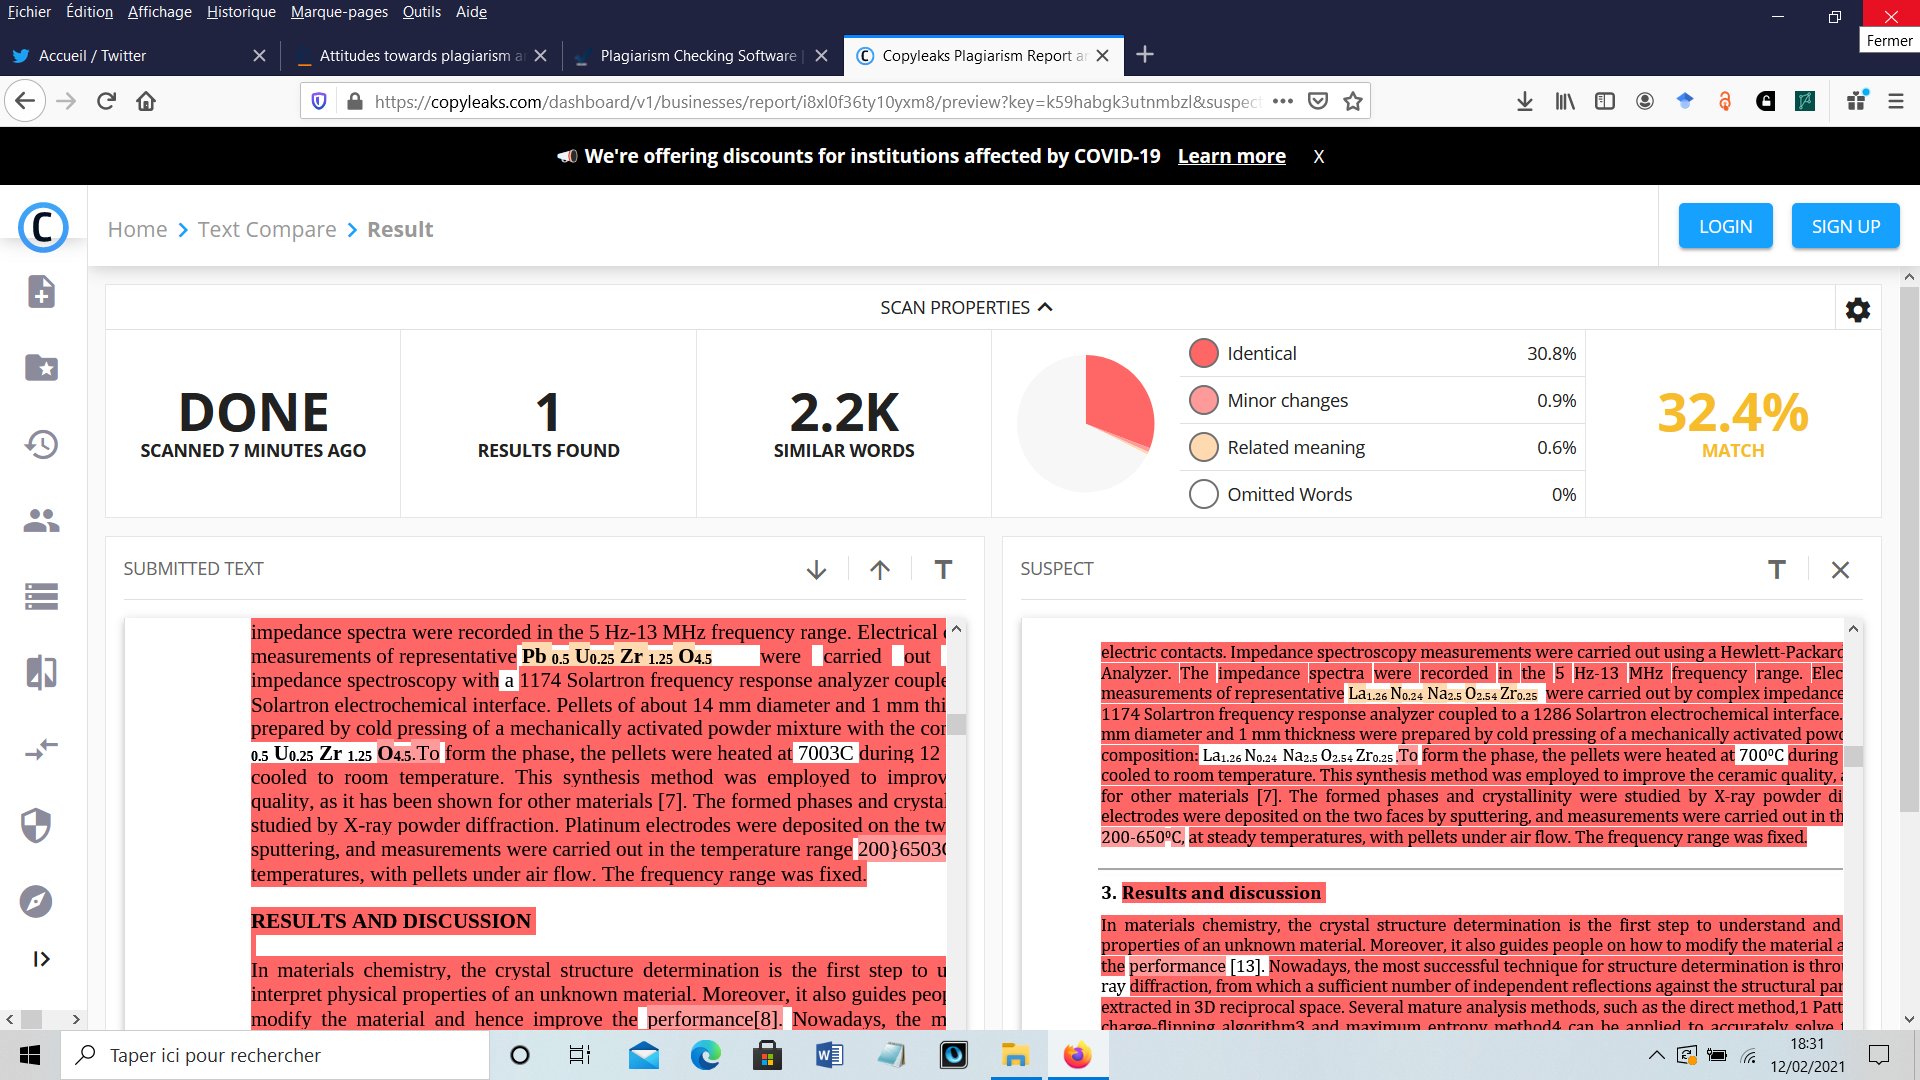
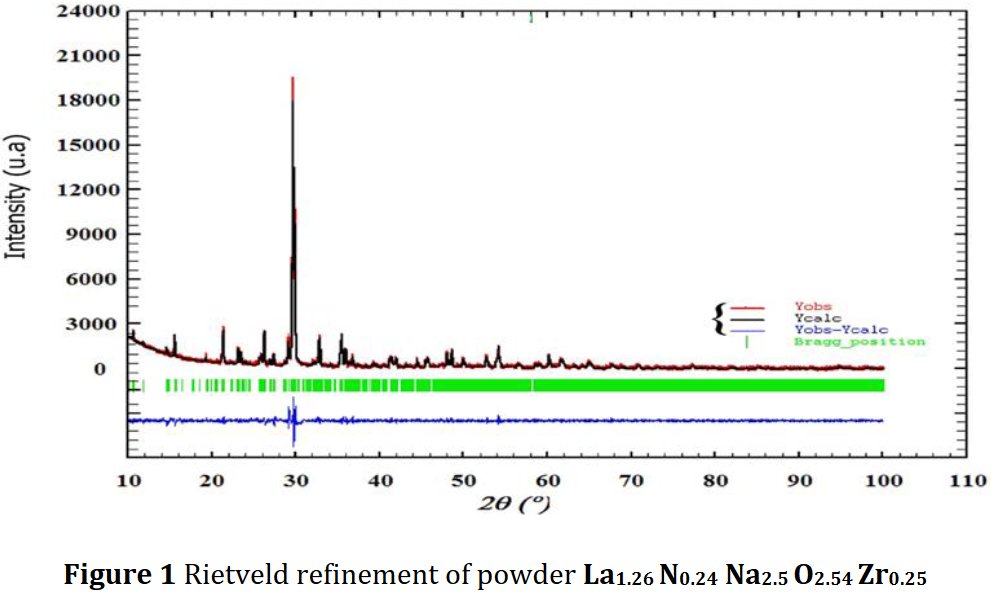
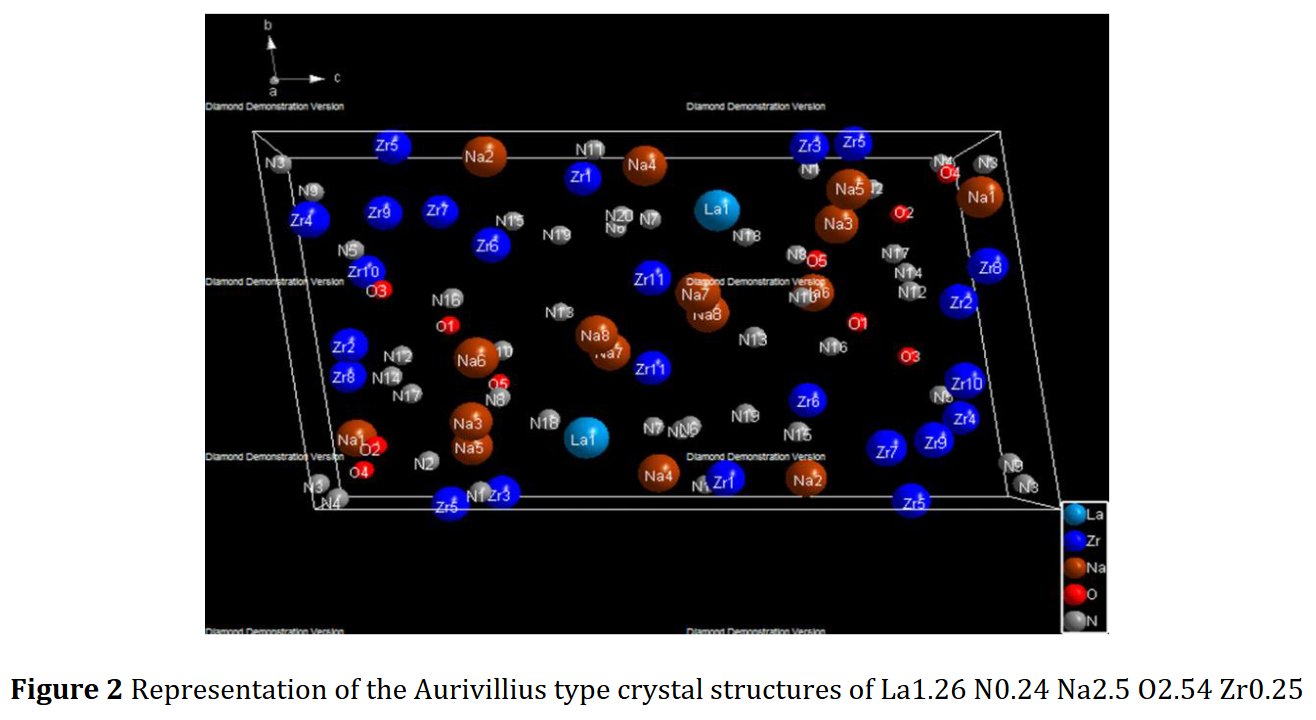
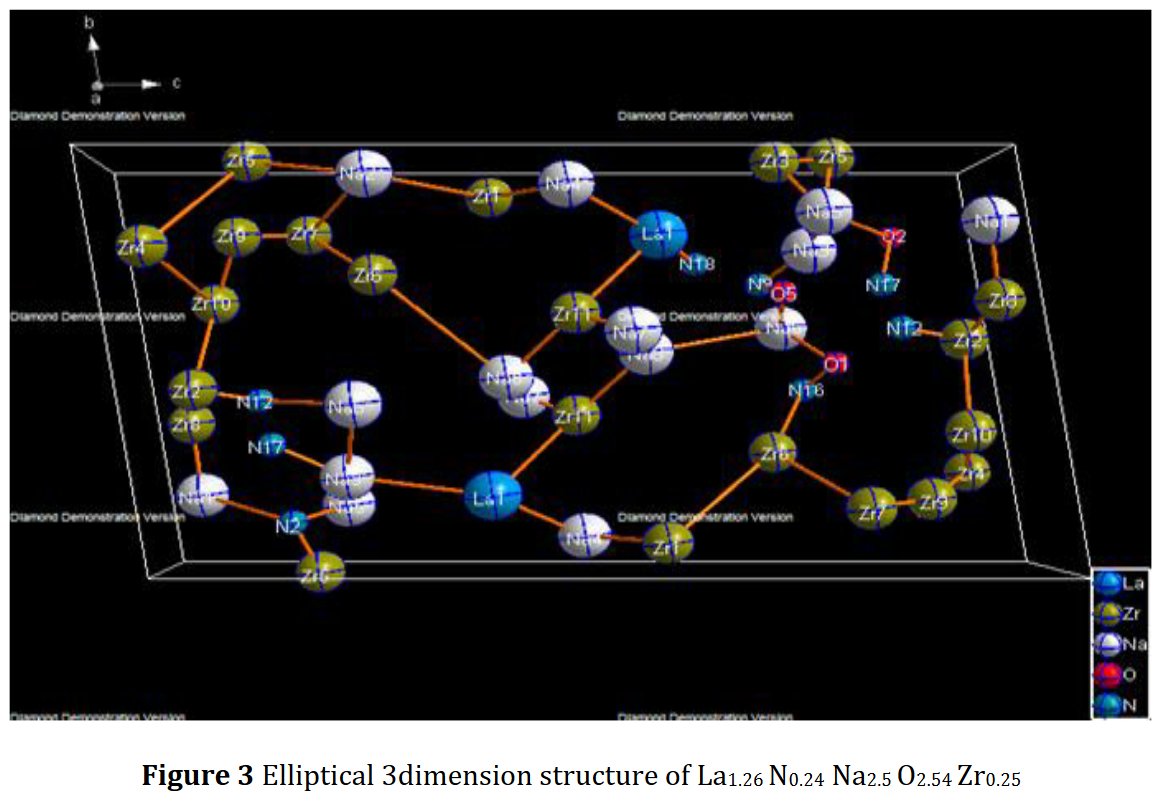
Much later, Another paper of the same kind was published, I received a new Google Scholar alert, and it became evident that incompetency did not explained all. The latest published paper contained the same Rietveld plot but for another compound just as foolish as the previous one La1.26Zr0.25Na2.5N0.24O2.54, triclinic as well [2] !
So then we were now facing deliberate fraud. The fact was discussed at Twitter :
December 1, 2020
https://twitter.com/xtalb/status/1333797045983797263
« That is enough ! Who can stop it ? Two papers, same powder pattern, almost same text, different formula and two impossible structures ! Many other crazy examples. Any powerful International Union of Crystallography somewhere ? »
Then another such case of same figure reused in two different older papers from the same authors was discovered by a participant at Twitter [3, 4].
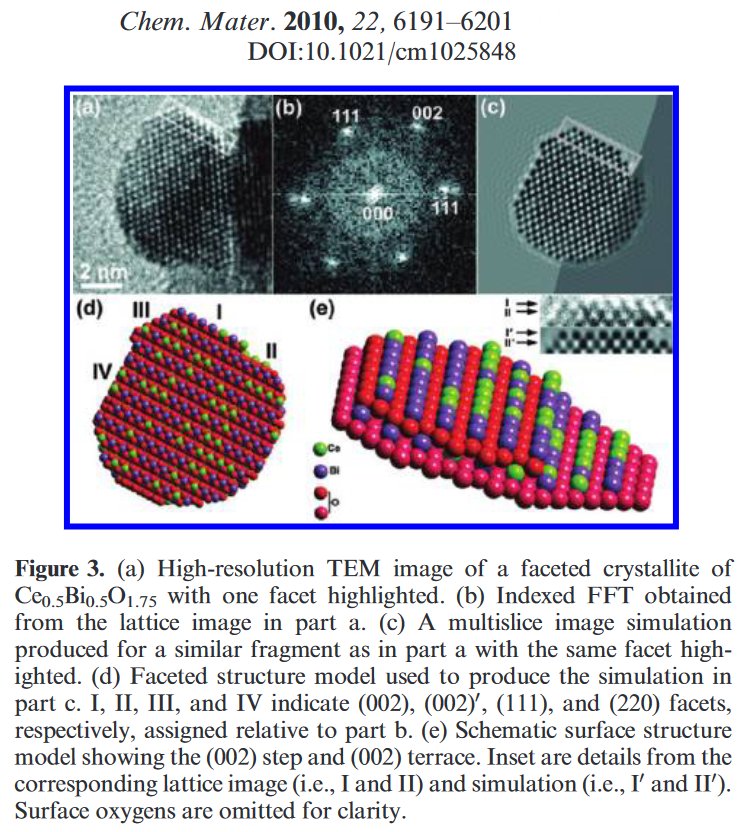
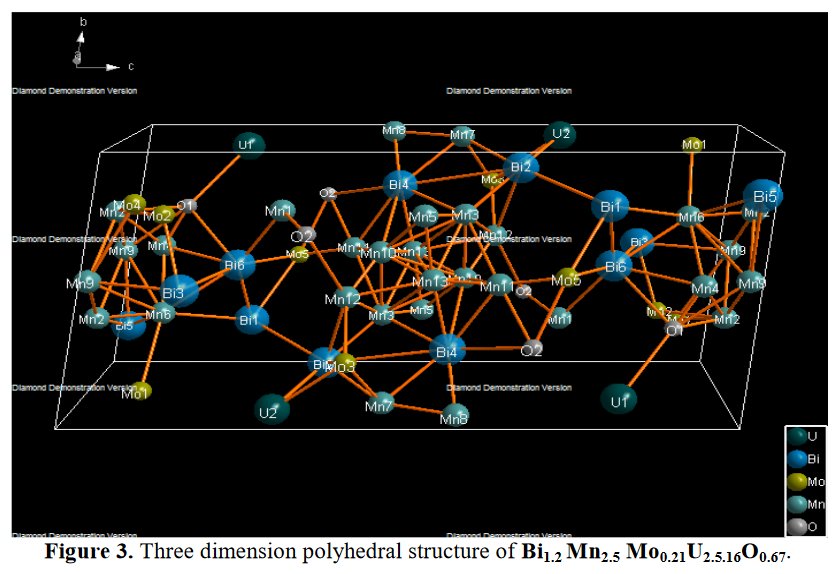
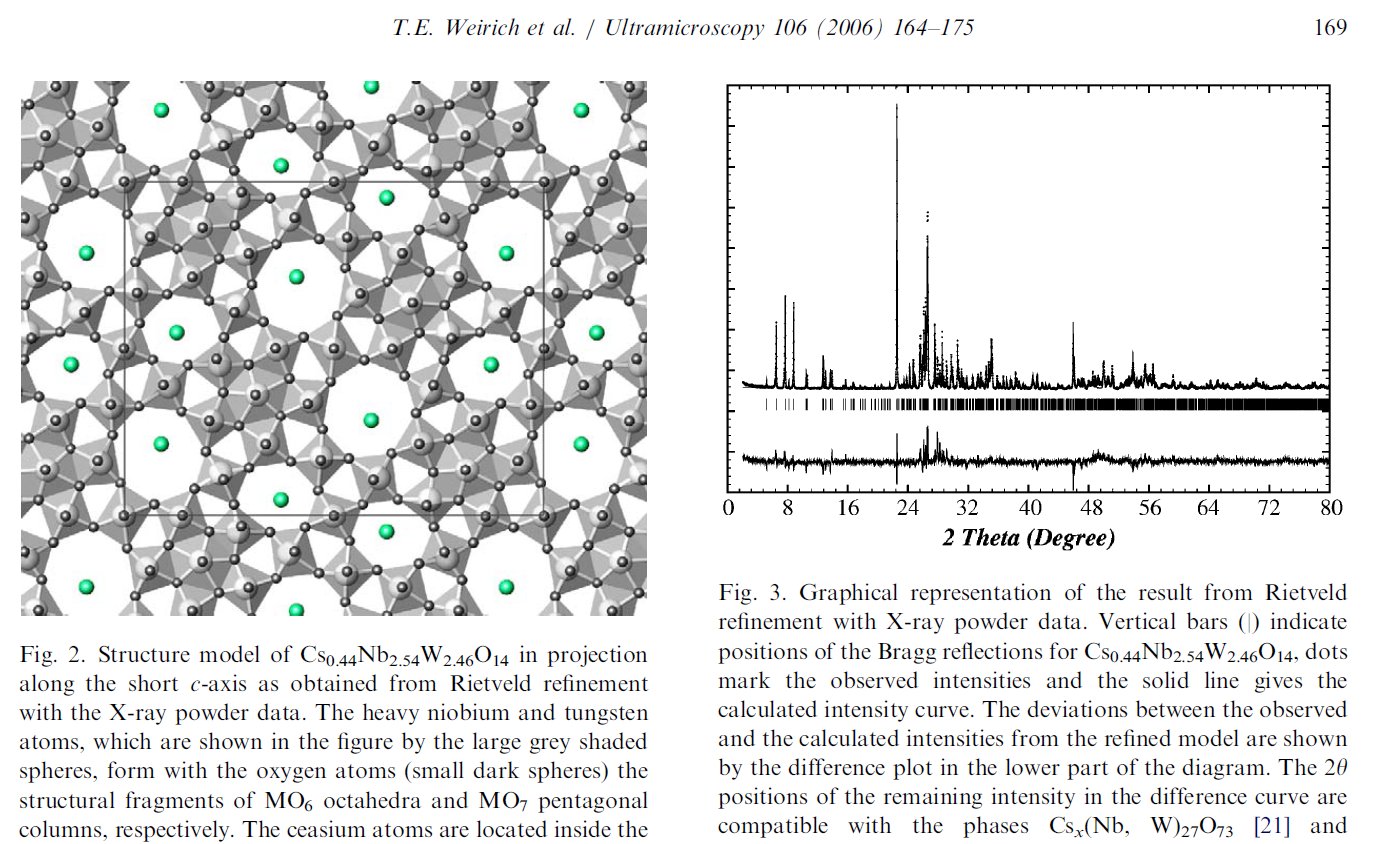
Searching more, I could find that this second figure was indeed reused another time in a third paper from the same authors [5]. Then I searched if I could find other reusings by a search at Google using the image. The original paper in which the image was stolen appeared to be dated 2006 [6], with no common author.
Then I started to send comments at PubPeer on several papers that could be identified by a DOI. Commenting there supposes to provide the email of the authors which are then informed. No answer from the authors received yet.
A text was sent to the Kathmandu Post
https://www.facebook.com/kathmandupost/
by the Facebook Messenger way :
« You may be interested in a starting controversy about some published papers from P. Mishra discussed at PubPeer indicating fraud : https://pubpeer.com/publications/6FB8D15B22C3F3B234E36D60BF0B31#3
No answer…
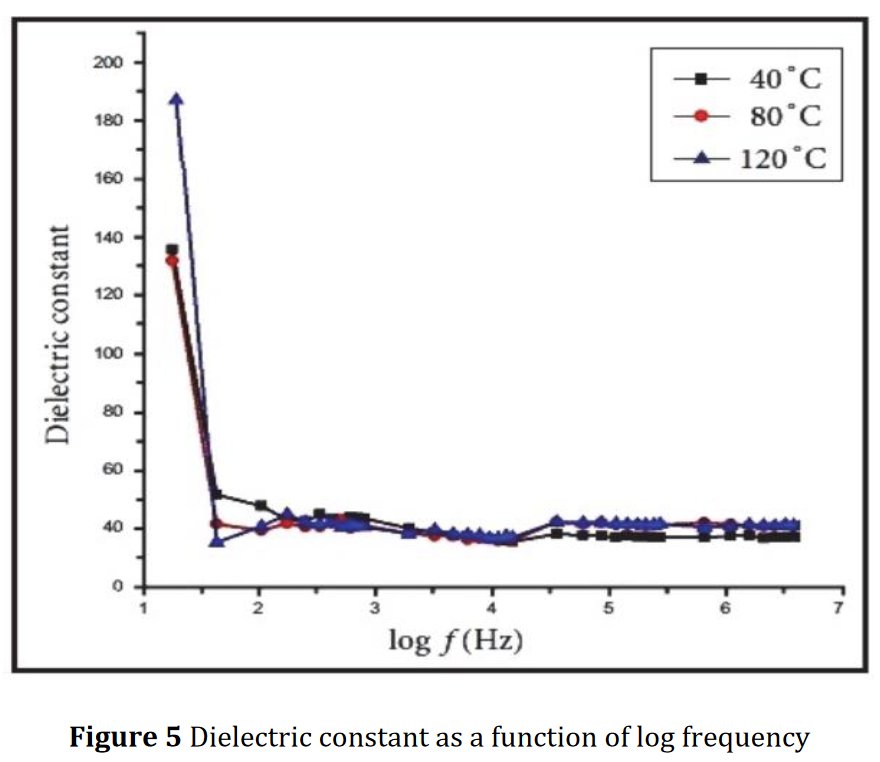
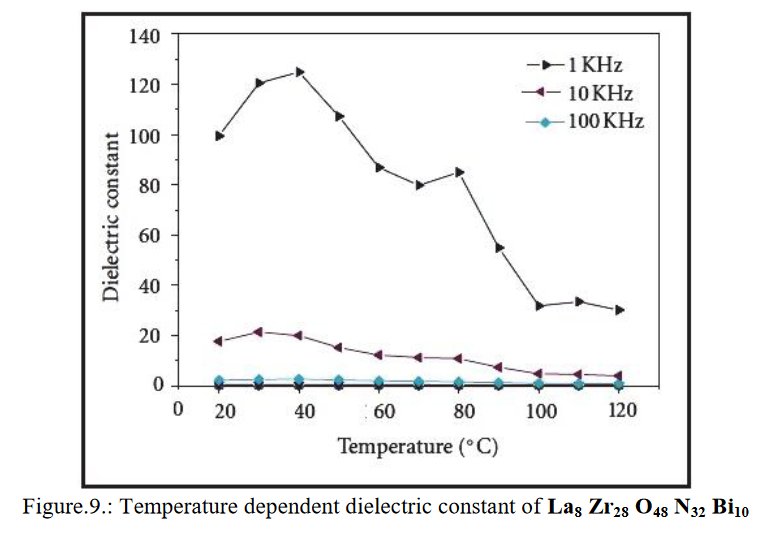
More searchs by images on Google Scolar could show that other figures are reused up to four times in different papers with Parashuram Mishra as main author, for instance that figure :
See the discussion especially at the « Crystallography Open Database » Facebook group :
https://www.facebook.com/groups/531629304301016
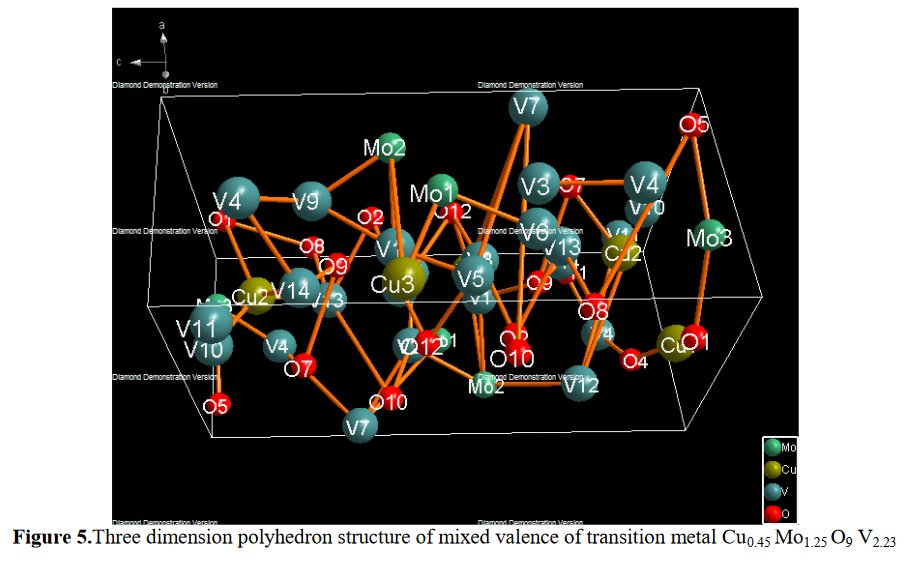
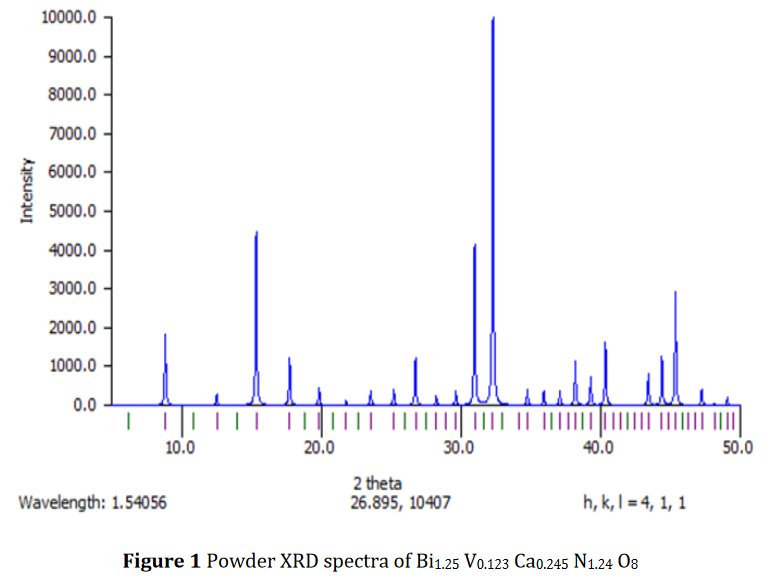
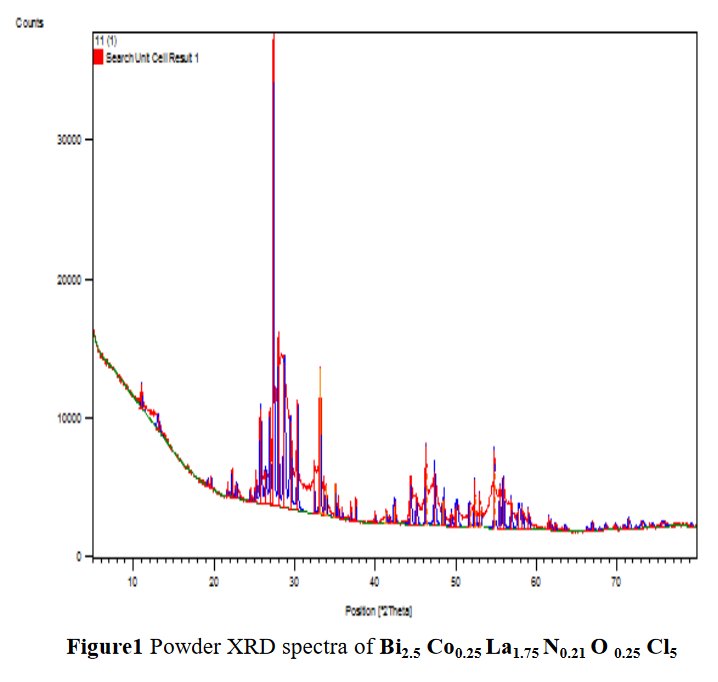
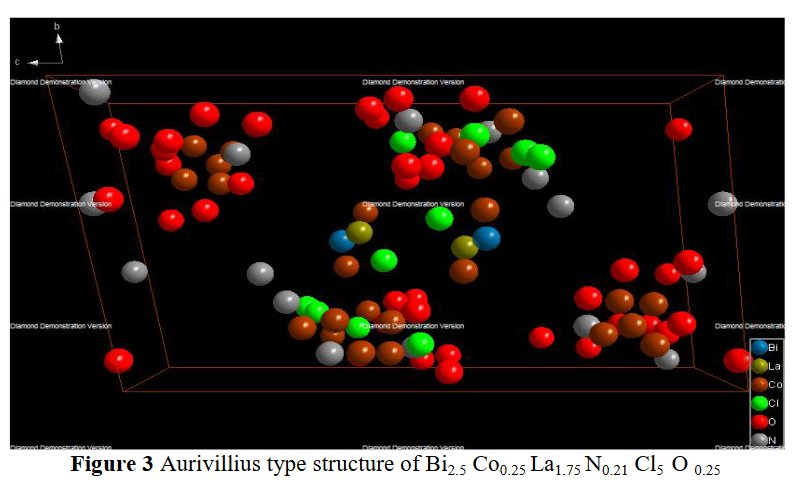
The exactly same figure is found three times in papers [1-2] and [7], for completely different compounds.
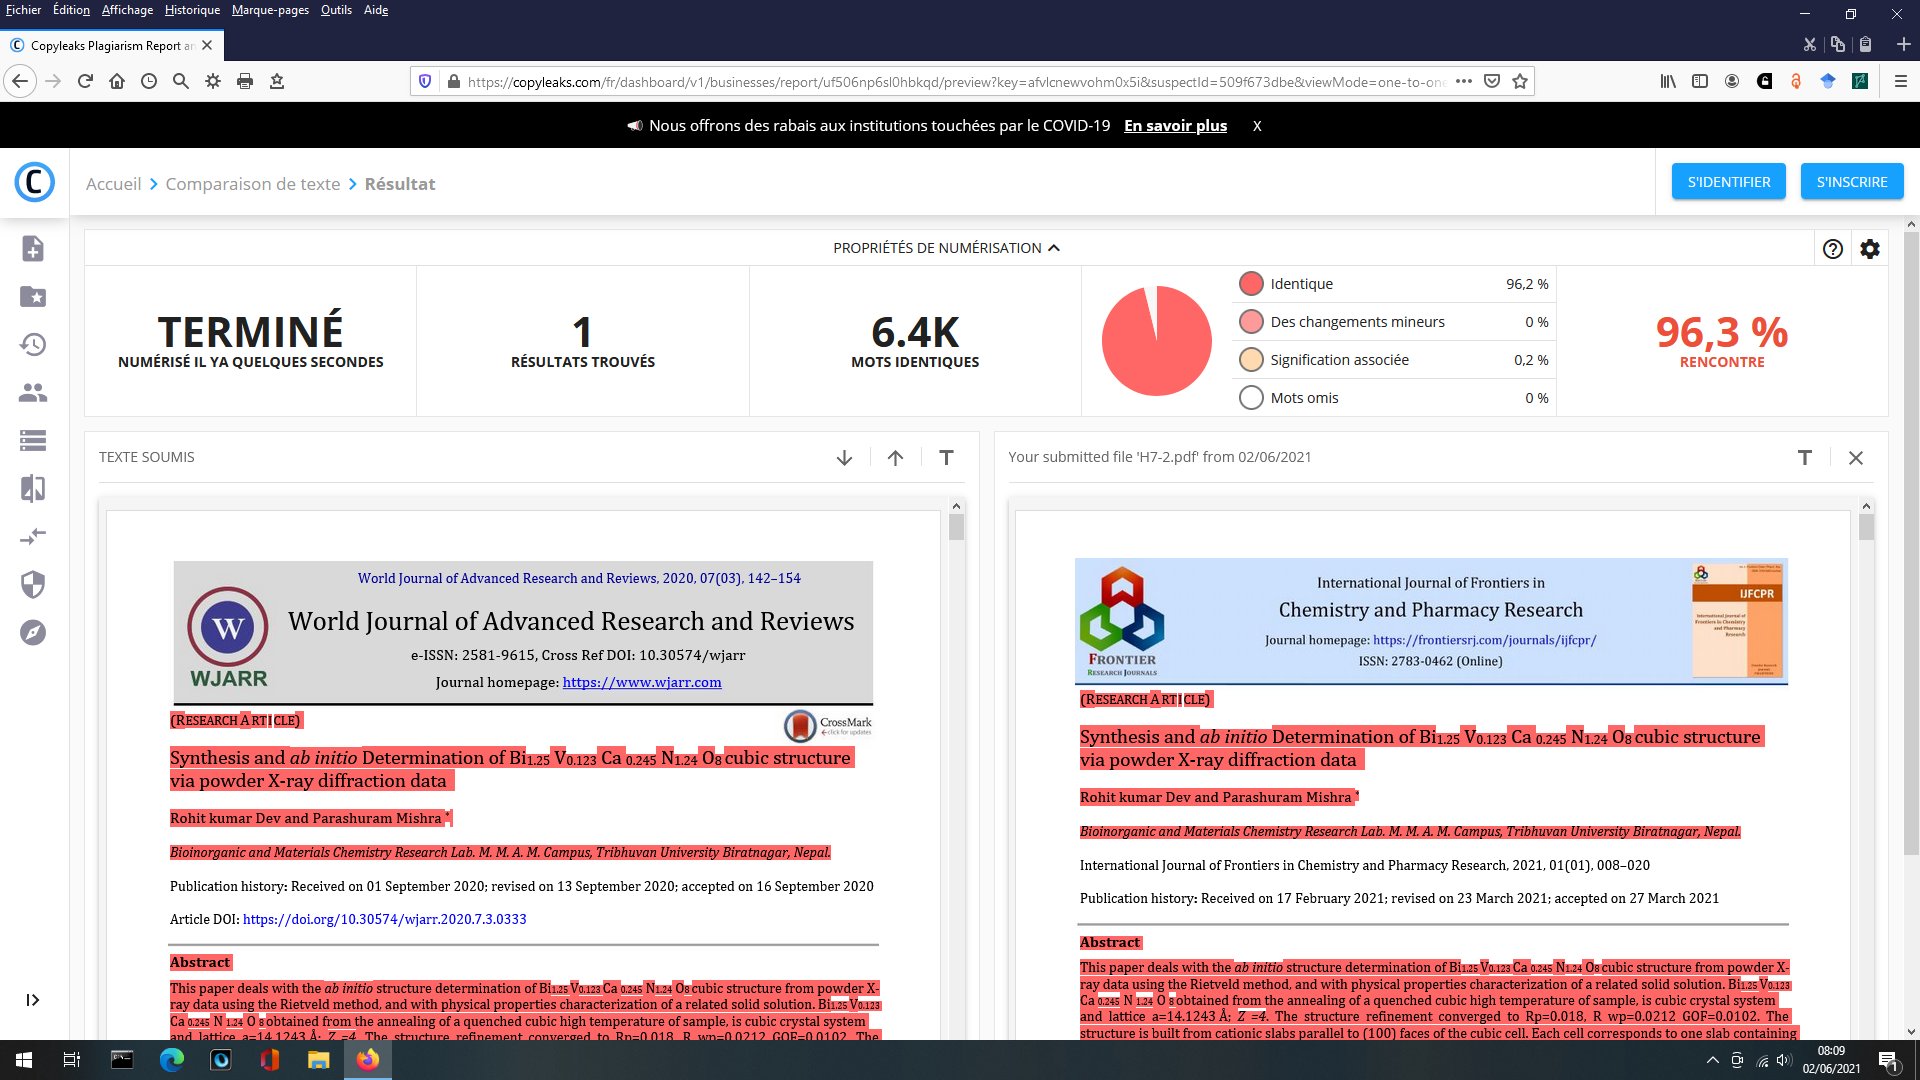
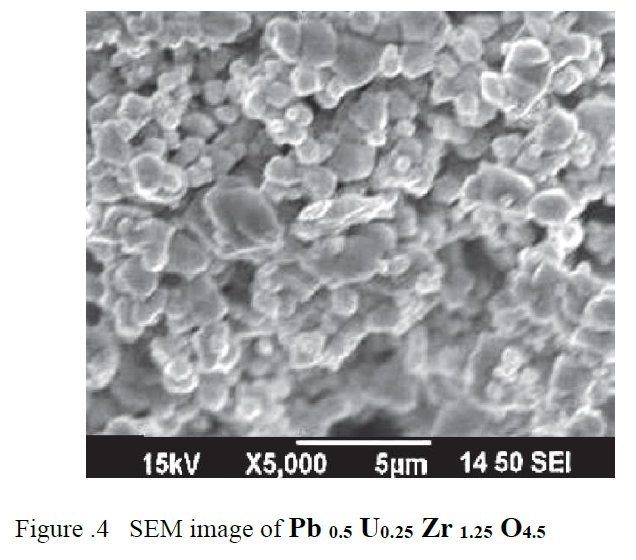
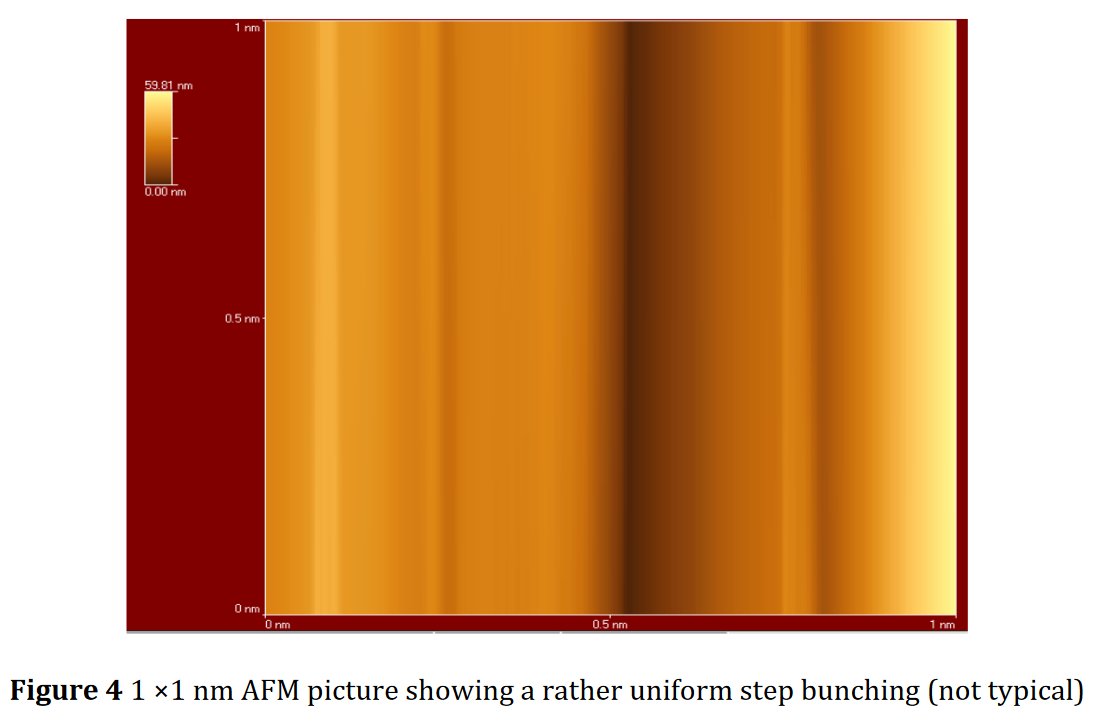
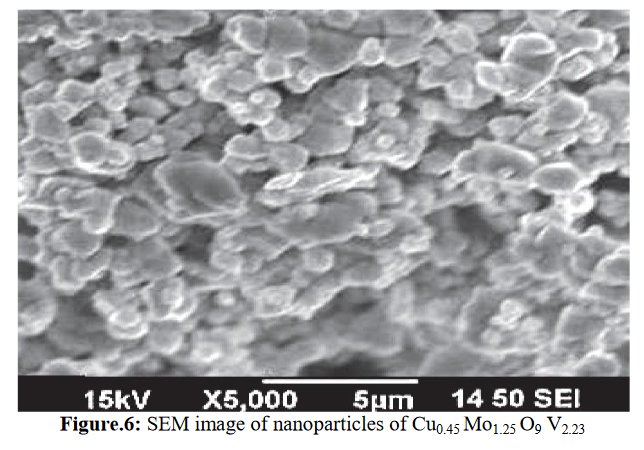
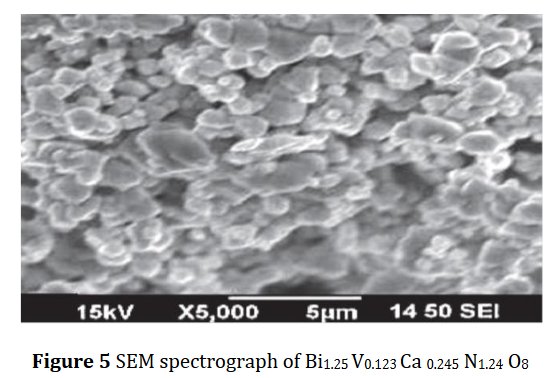
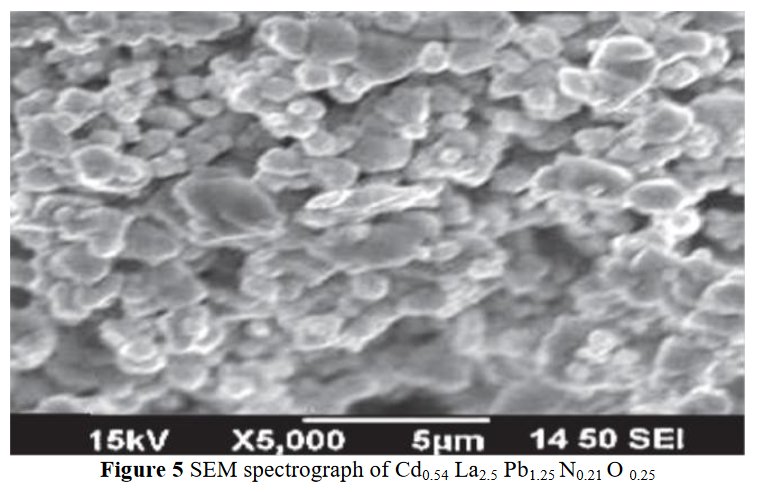
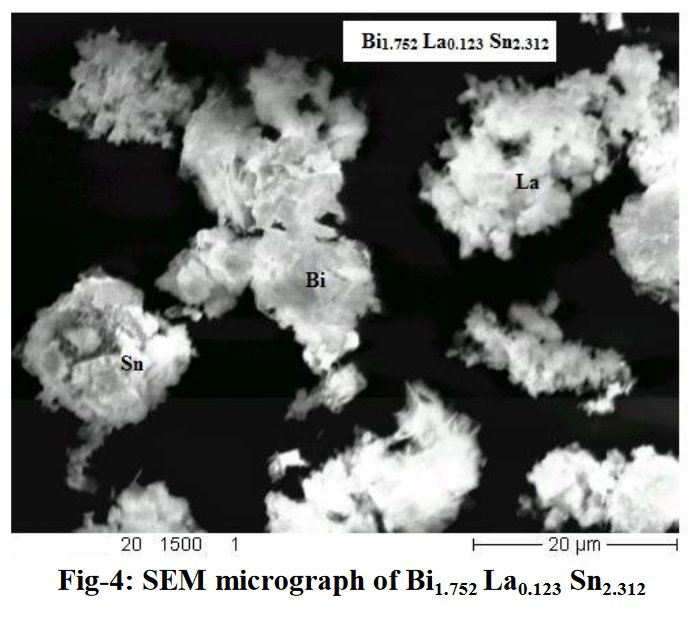
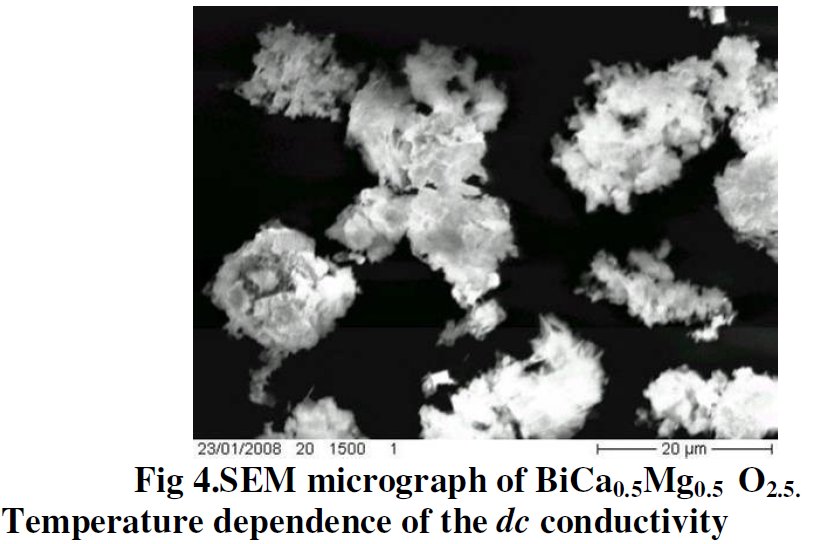
A SEM same figure but sometimes more or less elongated is found four times in papers [1] and [7-9] for different chemical compositions :
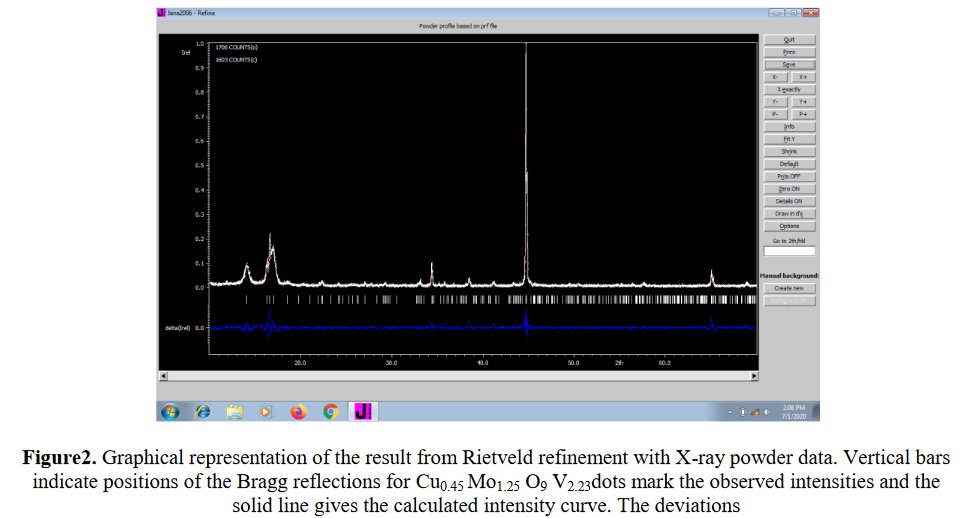
Also, same Rietveld plot for papers [8] and [9], not sure to what it corresponds exactly :
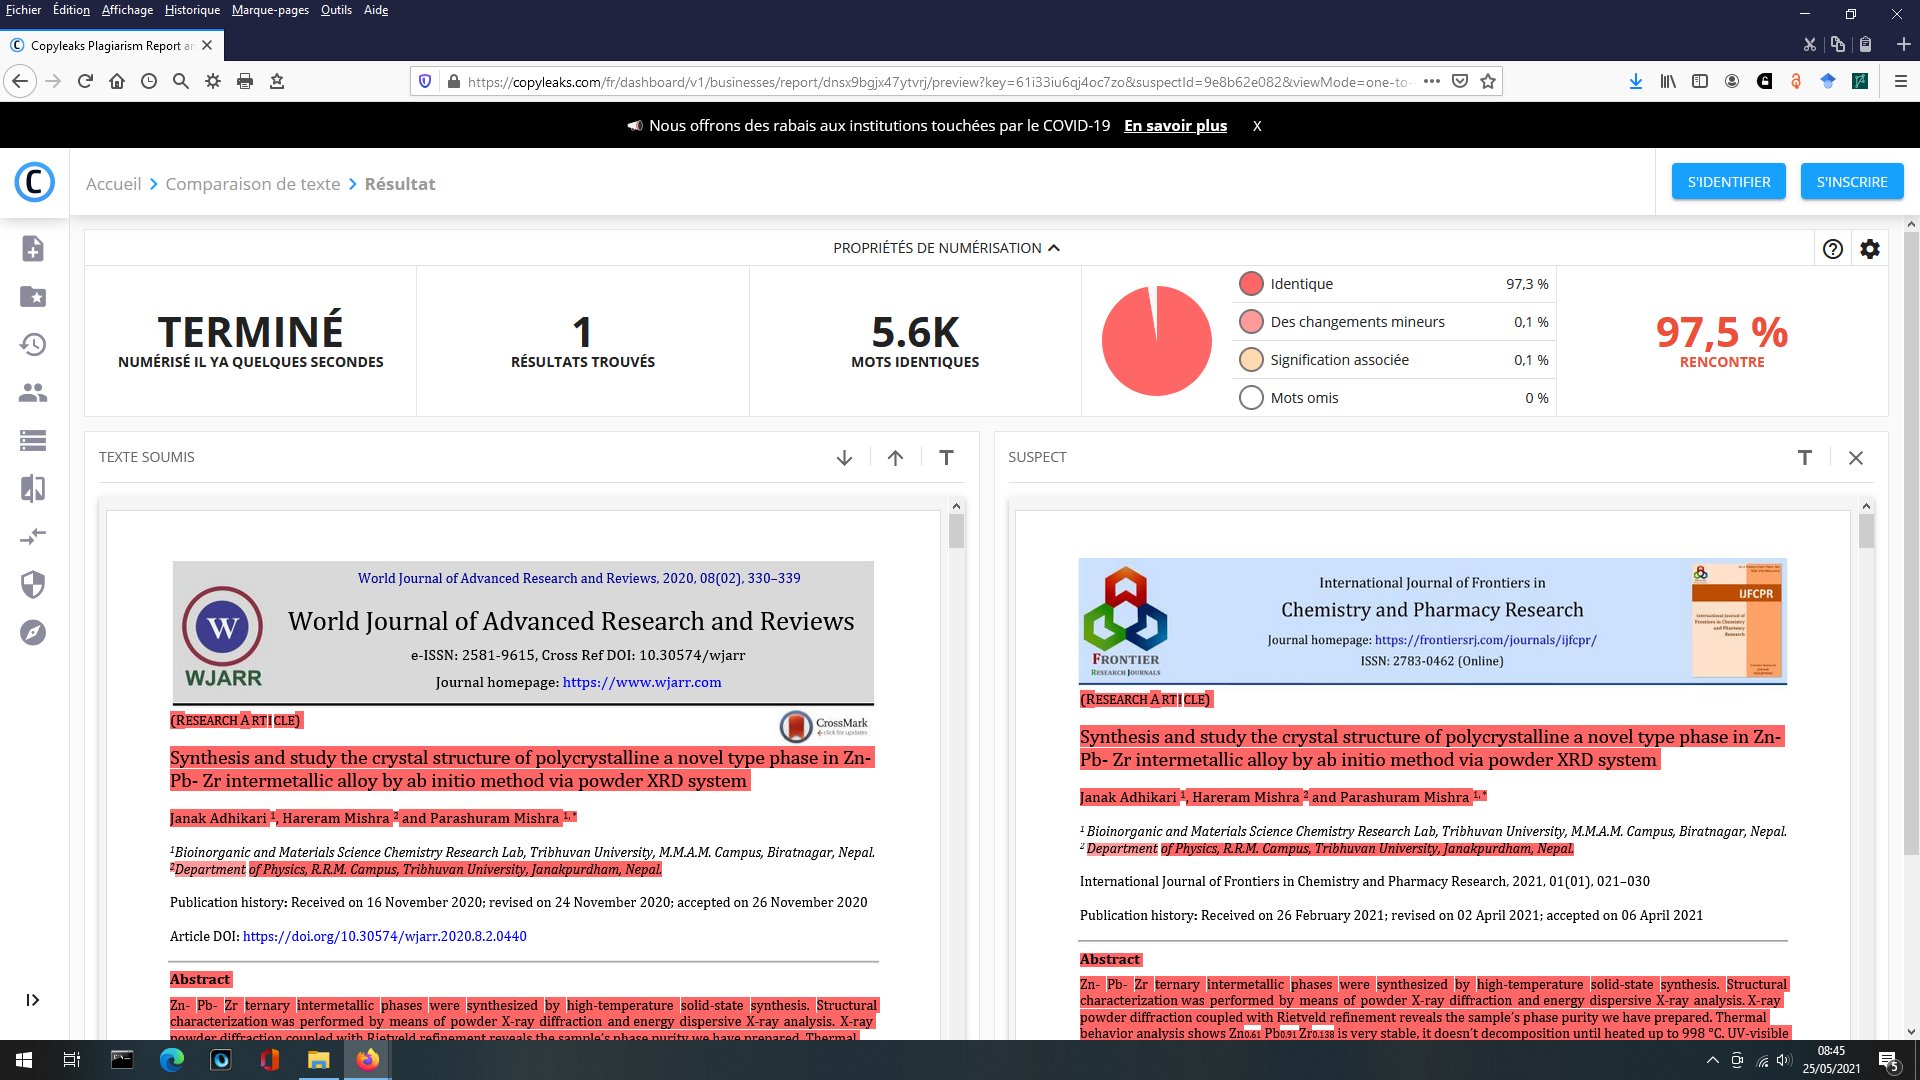
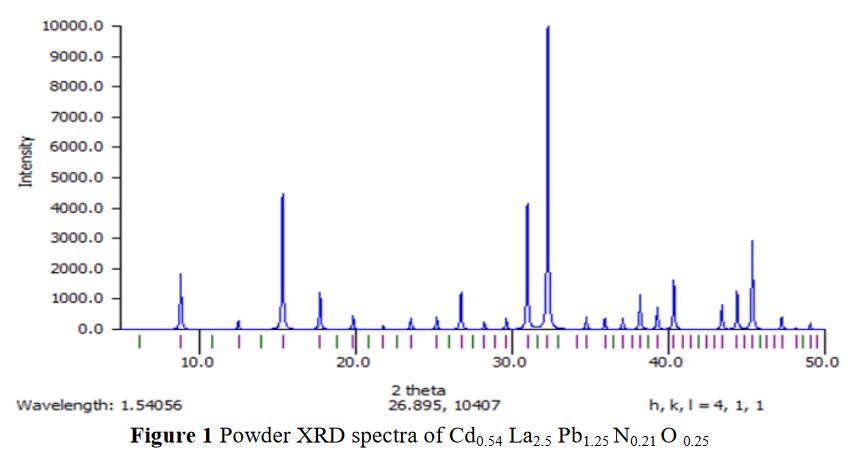
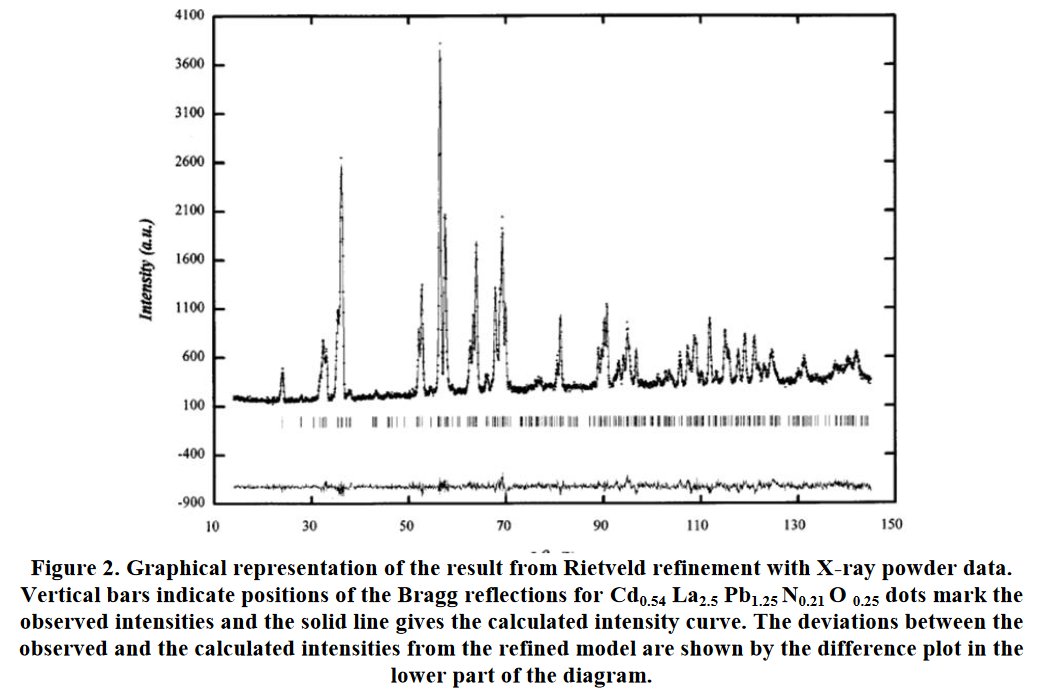
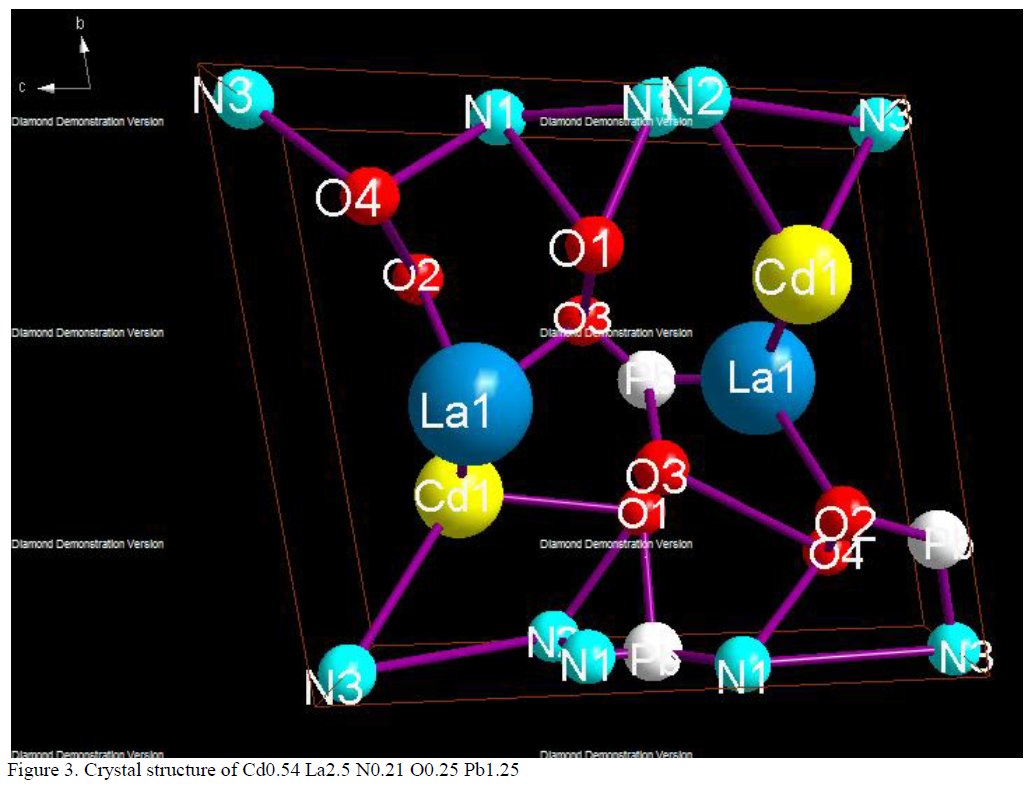
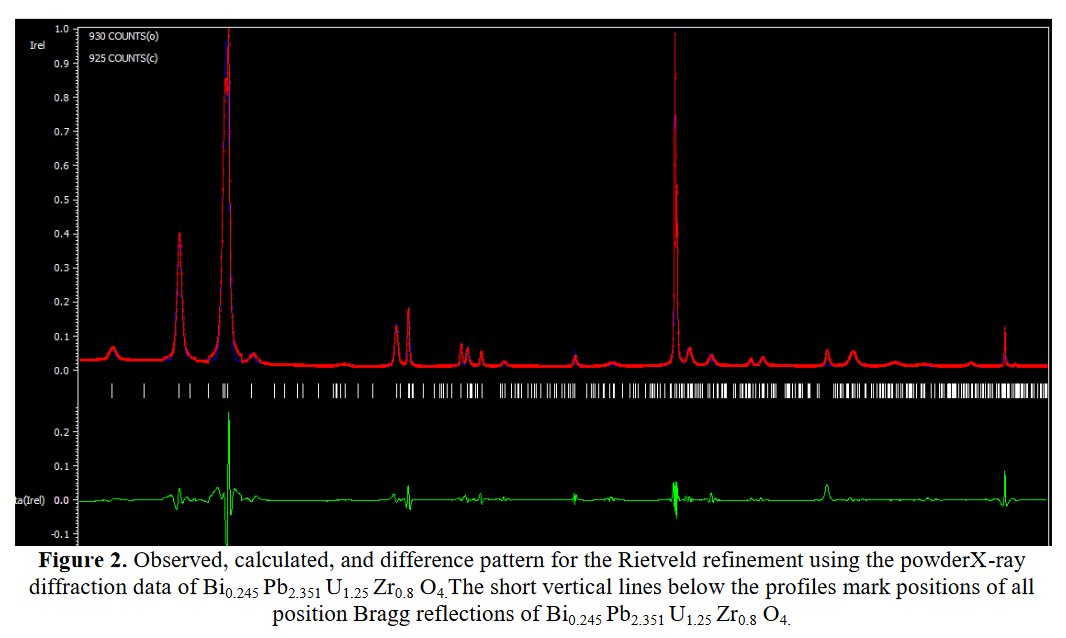
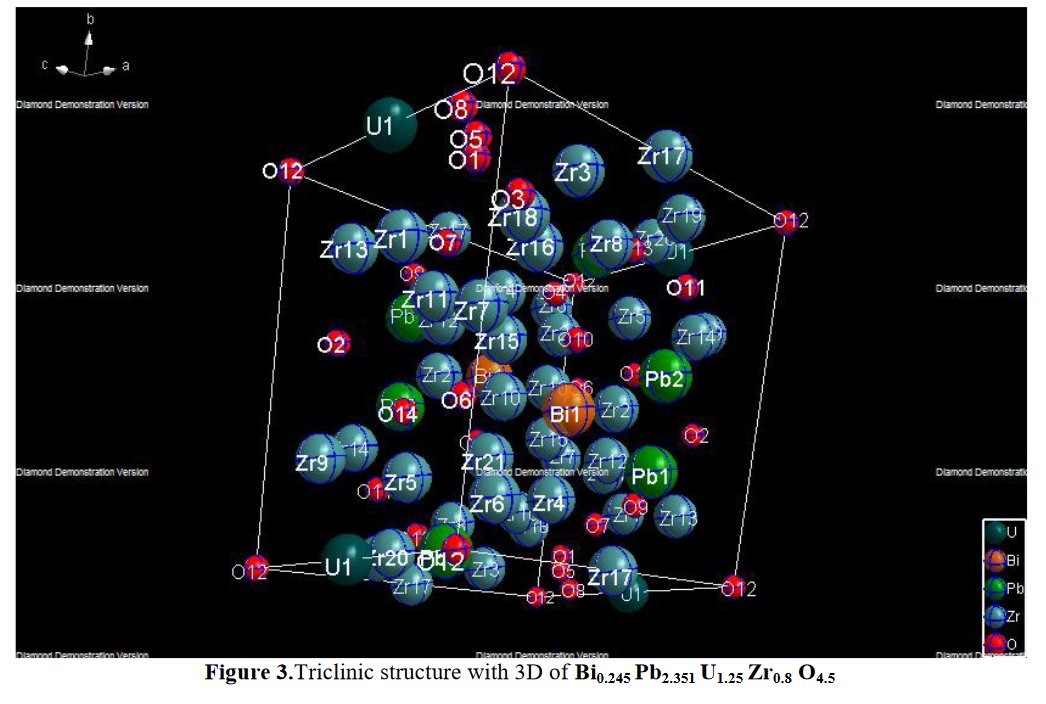
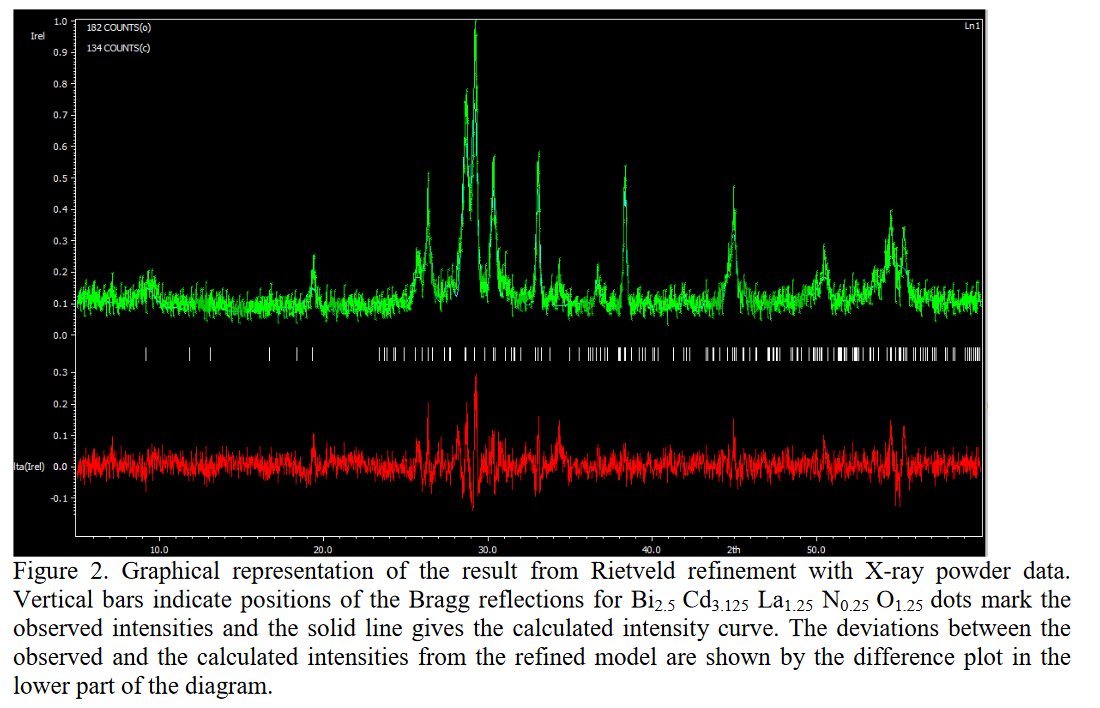
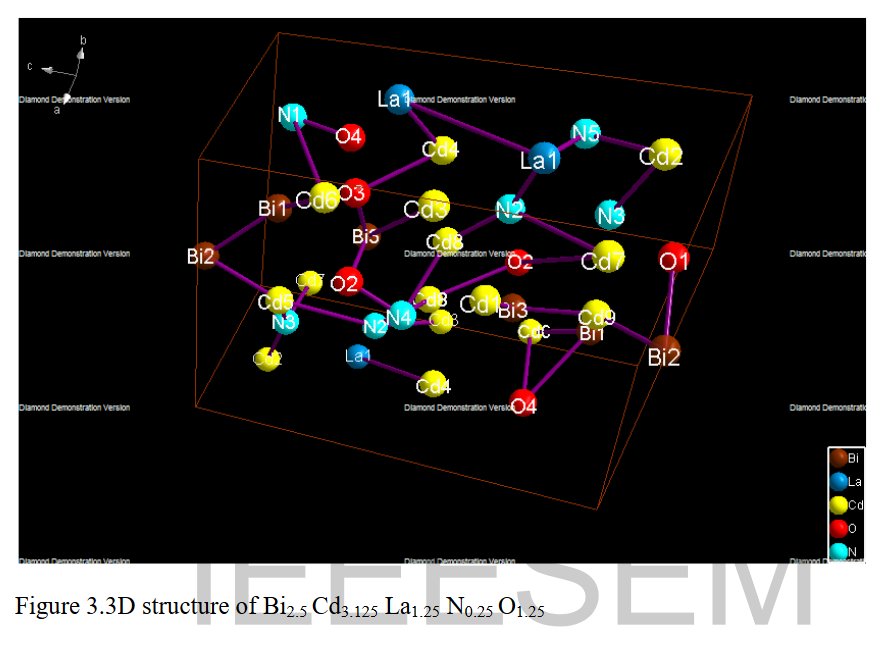
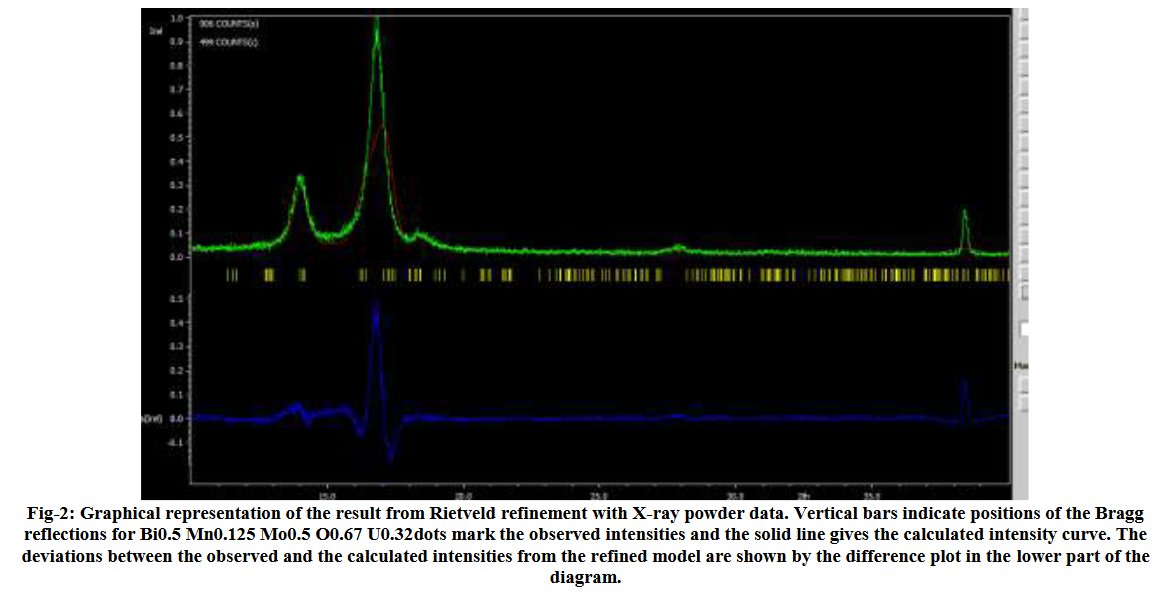
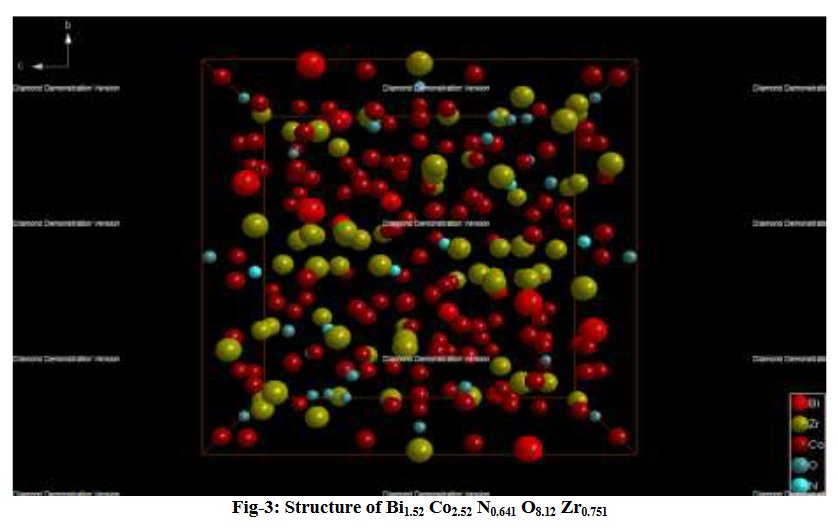
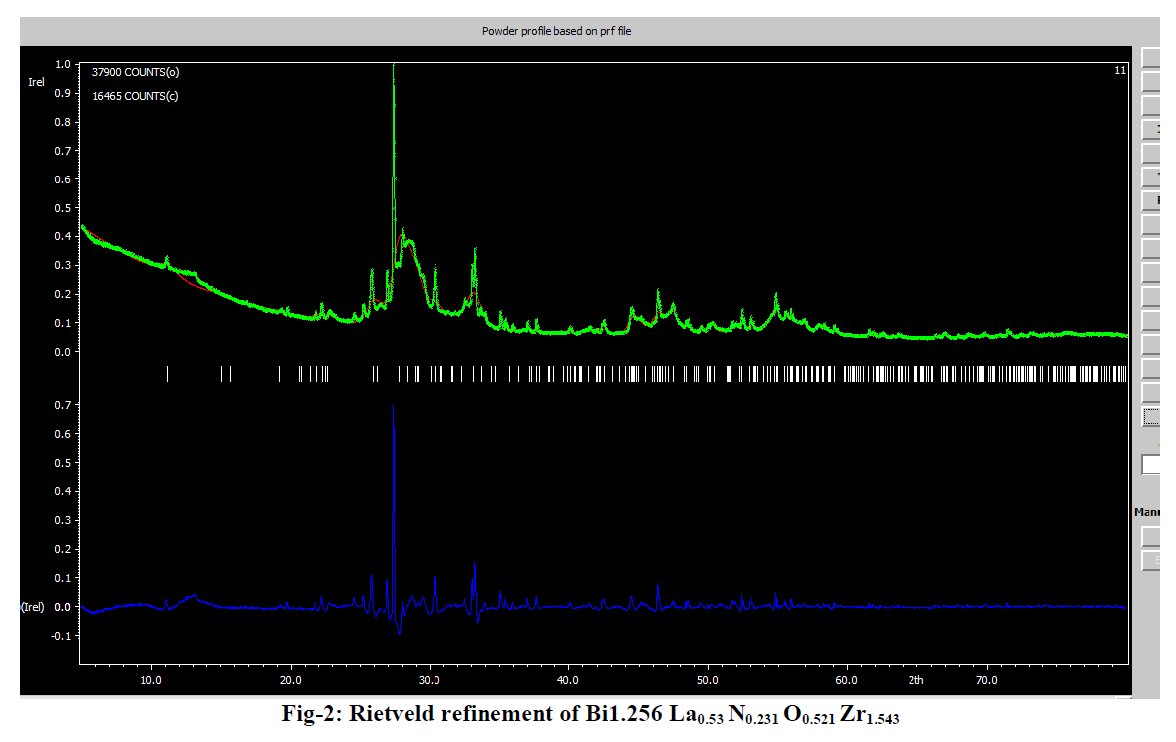
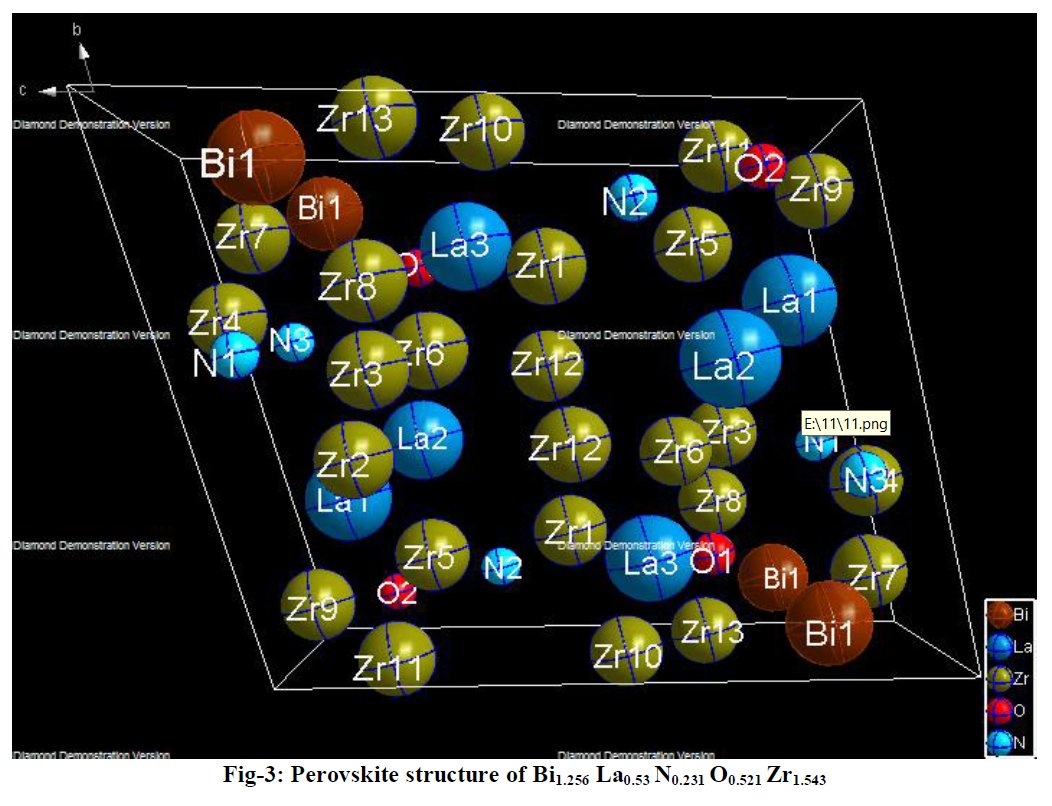
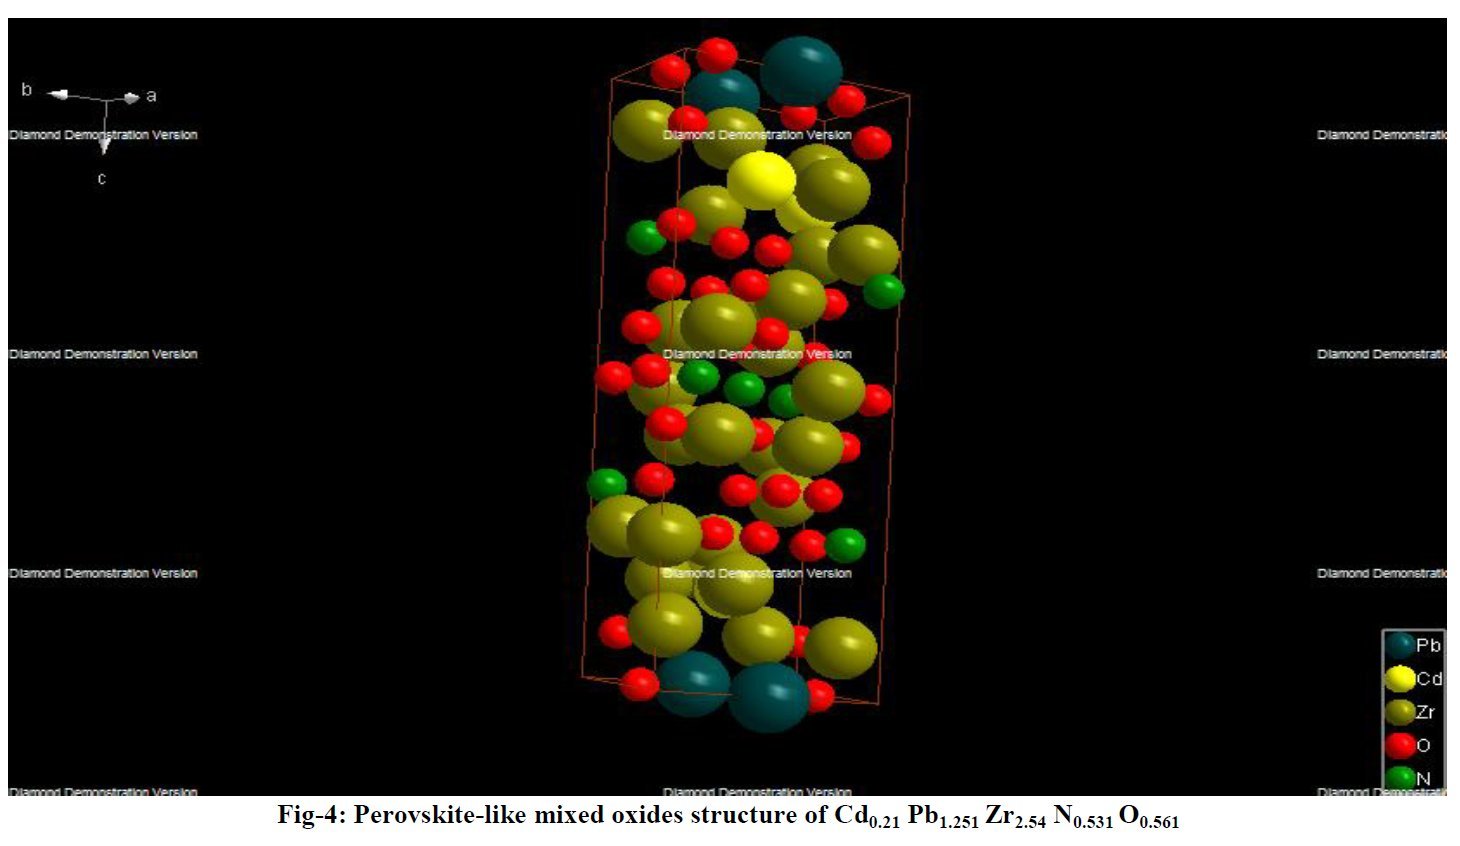
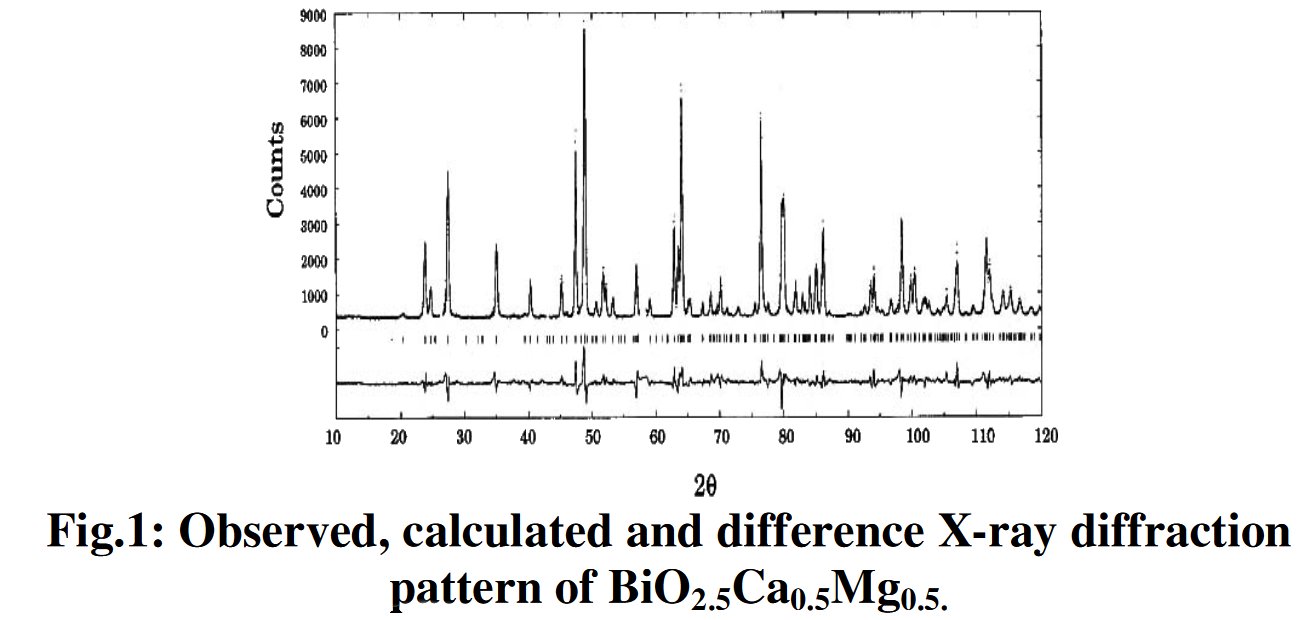
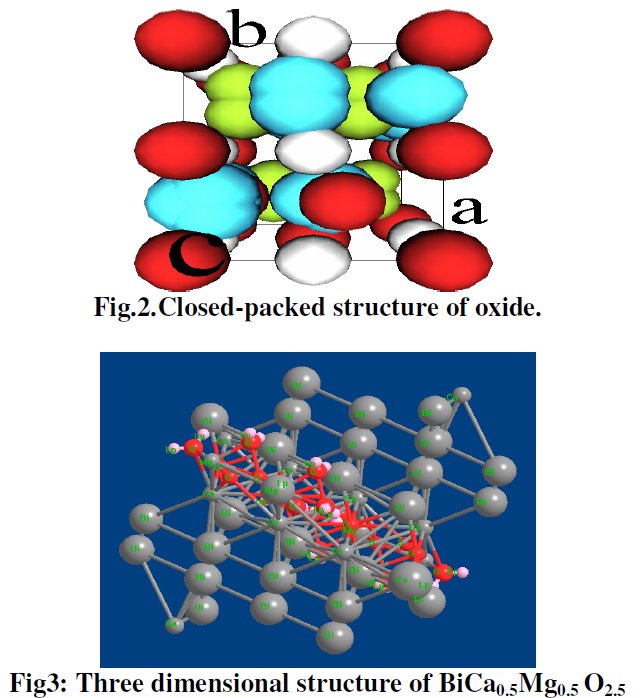
Other compounds with improbable formula are described from powder diffraction studies in similar way : Bi0.245Pb2.351U1.25Zr0.8O4.5 [10], Bi2.5Cd3.125La1.25N0.25O1.25 [11], Bi1.52Co2.52Zr0.751N0.641O8.12 [12], Bi1.256La0.53N0.231O0.521Zr1.543 [13], Zn0.61Pb0.91Zr0.130 [14]. A comment about the last, the following text inside brings a serious doubt about its credibility level : " The diffraction spots from powder crystal data were indexed in primitive hexagonal crystal system with the Laue group m3m. The non-centrosymmetric space group P 63/m c m (193) was chosen based on the Laue symmetry and condition of systematic absences." There are two basic crystallography misunderstandings since P63/mcm is centrosymmetric and the Laue group m3m corresponds to cubic.
.
Adding my point of view about these thirteen structure determinations of inorganic compounds from powder diffraction data by P. Mishra, since this is my specialty :
1 - None would pass a CHECKCIF test, especially that uranium-lead-zirconium oxide compound having a cell parameter a <2 A which the PLATON software refuses to read because of that (U-U interatomic distance < 2 A !!).
2- All these structures are impossible ones because they are based on a false cell (generally a large triclinic one). No figure of merit is given for the indexing step.
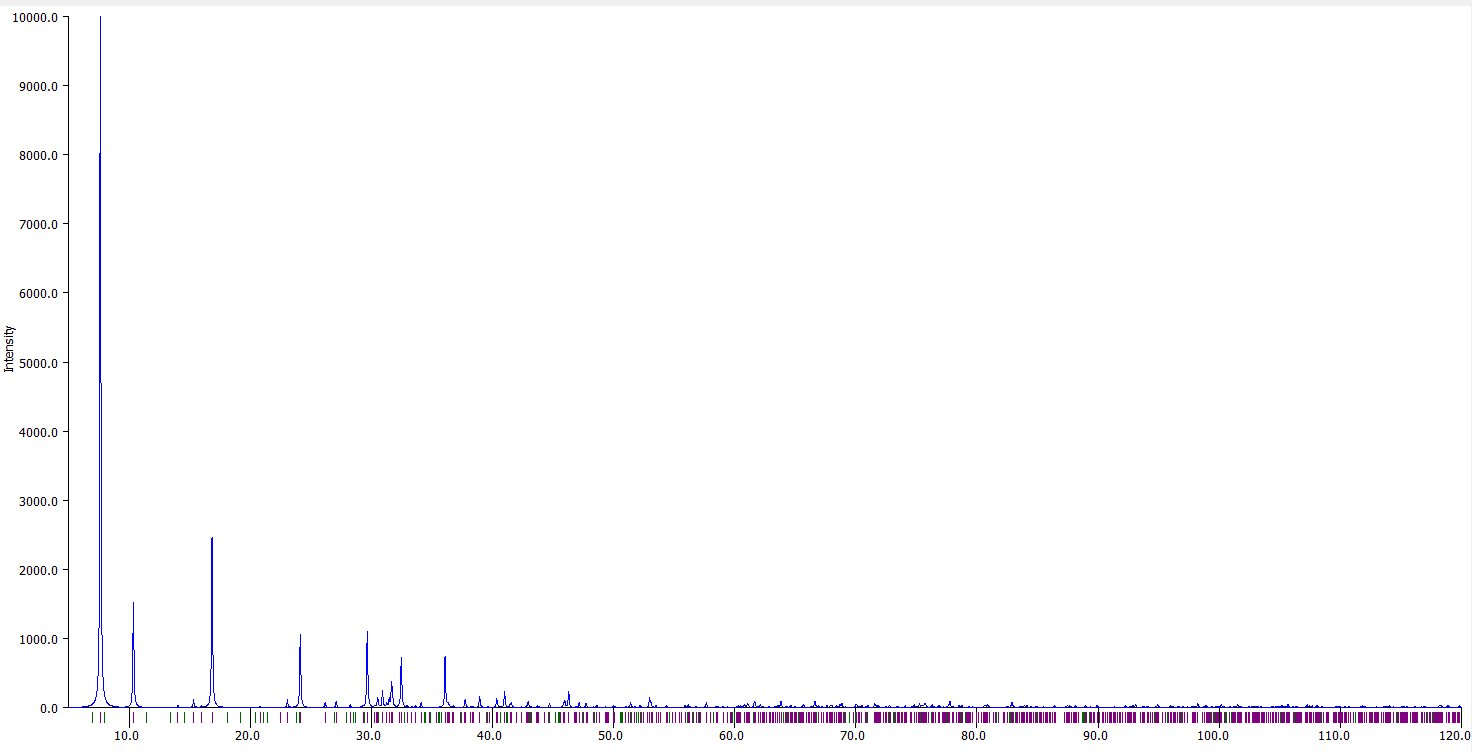
3- The false large cell is able to produce a seemingly correct Le Bail fit due to an extremely large number of peaks so that there is always enough possibilities of false peaks at every angle of the powder pattern, then a pseudo fit is obtained.
4- from the extracted intensities, structure solution in direct space (or else) will produce a list of atoms having not any sense. But P. Mishra does not care about nonsense and take the software proposals as correct !
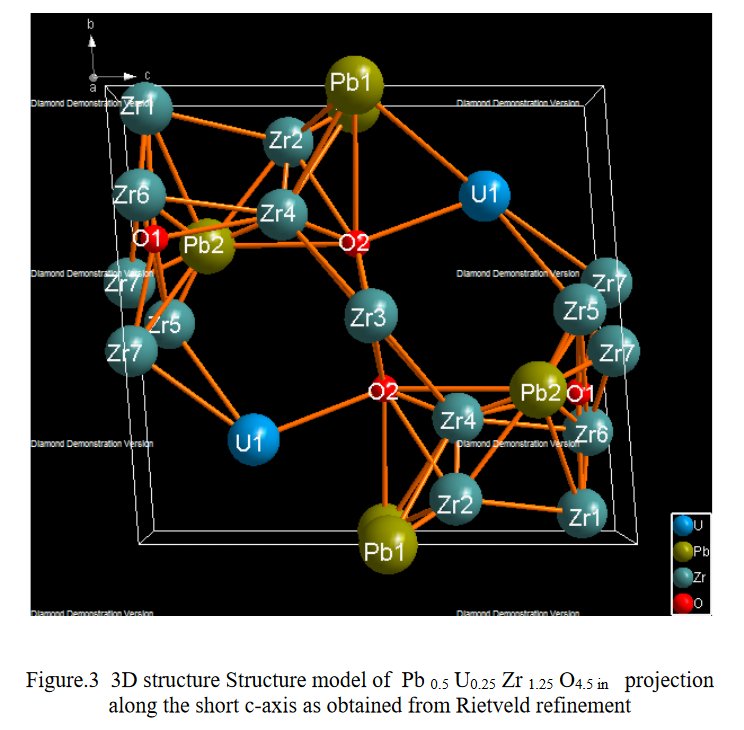
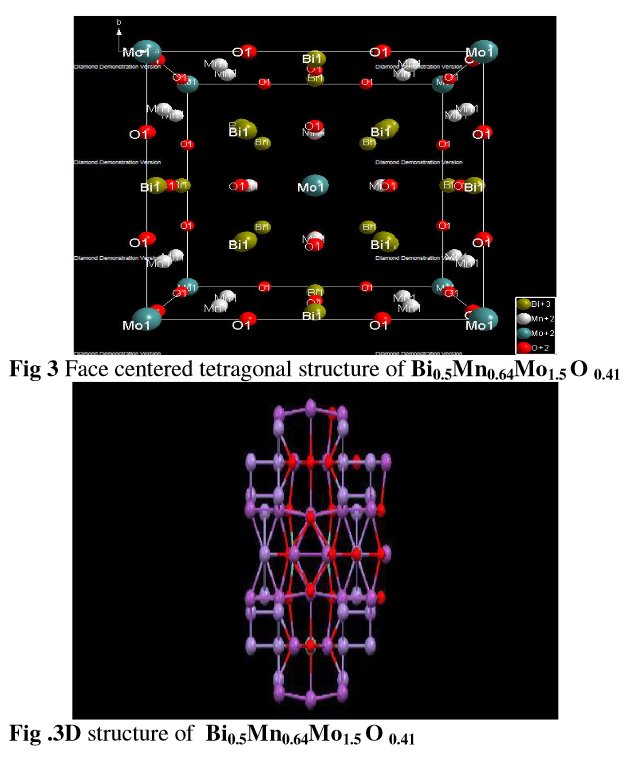
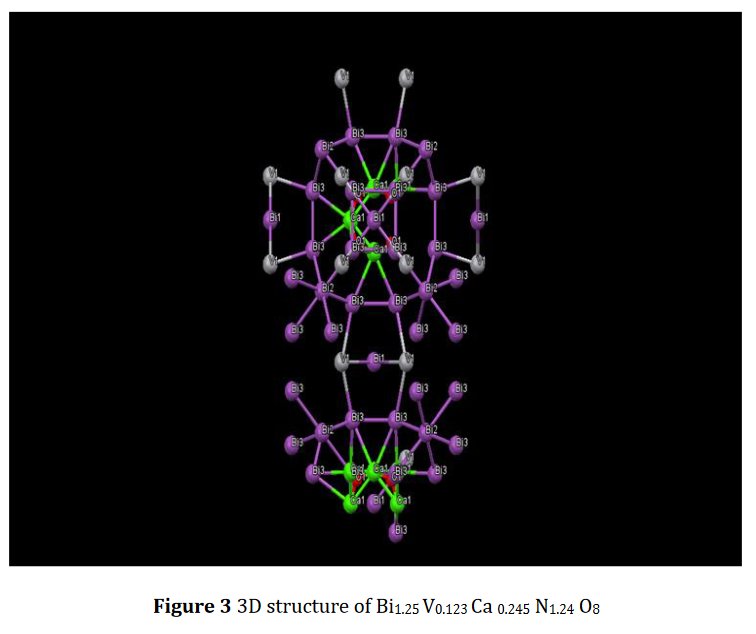
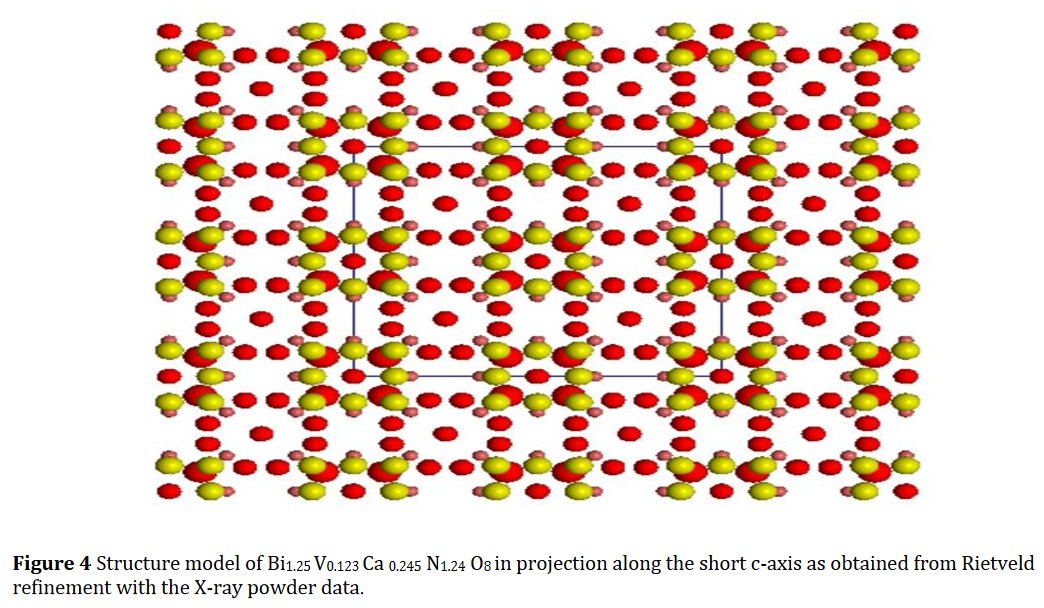
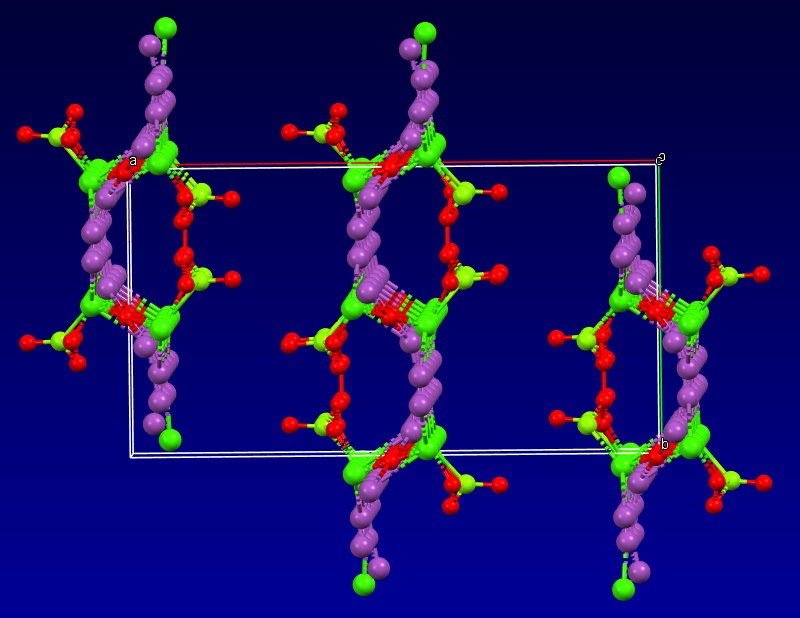
5- Then, no table of interatomic distance is provided, this would be too frightening and crazy, only long table of angles are given, sometimes several pages long. The structure drawings look all insane.
6- A dozen of such crazy structures are already "published". It would be better to stop such a demonstration of full incompetency.
All these thirteen structures were published in 2020. And what about the years before ? There are a lot of other PXRD works, molecular modelling, on organometallic compounds, cell parameters provided, no atomic coordinates available, but tables of interatomic distances are sometimes shown in which impossible values are found. So, again, very probably the same kind of structure determination starting from a wrong (generally triclinic) cell was applied. The list is too long to be given here. A systematic search about figures reusing was not undertaken.
Some comments made at PubPeer on a few papers :
[15] The impossible bond lengths indicate big problems in the structure determinations from powder data. Most probably the cell parameters were wrong but still used leading to incoherent results : O(58)-Co(59) 1.059 Å O(60)-Co(59) 1.215 Å O(15)-Co(59) 1.197 Å
[16] Finding strange sentences in that paper, for example : "tetragonal crystal system with p3 space group" (!!!) Strange bond lengths (A) : O(59)-Co(32) 0.6801 Å O(39)-Co(32) 1.1215 Å N(45)-Cu(59) 1.3338 Å N(16)-Cu(59) 1.3396 Å. Crystal structures from powder data, only one powder pattern shown from which it is hard to believe any correct indexing.
[17] Seriously ? A so short Cu-N interatomic distance of N(12)–Cu(15) : 1.3443 Å ? From never shown powder diffraction patterns indexed in triclinic ? No...
[18] Pretending having solved such a complex triclinic crystal structure from that powder diffraction pattern is simply impossible. "a = 6.753 Å, b = 13.904 Å, c = 20.122 Å, α = 142.76°, β = 106.580° and γ = 72.4343°." Indexing itself is obviously wrong.
MORE if you wish (I think to a total of > 50 crazy papers)
These papers are now built in an
industrial way, two per month or more !
References
[1] B. K. Kanth and P. Mishra, Int. J. Res. Appl. Nat. Sci. 6 (2020) 1-21.
[2] B. K. Kanth and P. Mishra, World J. Adv. Res. Rev. 8 (2020) 131-140.
[3] B. K. Kanth and P. Mishra, Intl. J. Envir. Sci. 9 (2020) 56-59.
[4] R. K. Dev and P. Mishra, Global Scientific Journals (GSJ) 8 (2020) 548-563.
[5] P. Mishra, Int. Ref. J. Eng. Sci. (IRJES) 9 (2020) 18-24.
[6] T. E. Weirich, J. Portillo, G. Cox, H. Hibst, S. Nicolopoulos, Ultramicroscopy 106 (2008) 164-175.
[7] B. K. Kanth and P. Mishra, Int. J. Eng. Sci. 10 (2020) 58-68.
[8] R. K. Dev and P. Mishra, World J. Adv. Res. Rev. 7 (2020) 142-154.
[9] Y. R. Sahu, R. K. Dev , K. Mishra and P. Mishra, Int. J. Eng. Sci. 10 (2020) 20-30.
[10] B. K. Kanth and P. Mishra, Int. Ref. J. Eng. Sci. (IRJES) 9 (2020) 41-48.
[11] R. K. Dev, Y. R. Sahu, K Mishra and P. Mishra, IEEE-SEM 8 (2020) 225-236.
[12]Y. R. Sahu and P. Mishra, Sch. Int. J. Chem. Mat. Sci. 3 (2020) 99-108.
[13] B. K. Kanth and P. Mishra, Sch. Int. J. Chem. Mat. Sci. 3 (2020) 1-6.
[14] J. Adhikari, H. Mishra and P.
Mishra, World J. Adv. Res. Rev.
8 (2020) 330-339.
[14-2] J. Adhikari, H. Mishra and P. Mishra, International
Journal of Frontiers in Chemistry and Pharmacy Research 1
(2021) 21-30. Same as [14]
[15] N. K. Chaudhary and P. Mishra, Int. Res. J. Pure & Appl. Chem. 7 (2015) 165-180.
[16] N. K. Chaudhary and P. Mishra, J. Saudi Chem. Soc. 22 (2018) 601-613.
[17] B. K. Singh, P. Mishra, A. Prakash and N. Bhojak, Arabian J. Chem. 10 (2017) S472-S483.
[18] N. K. Chaudhary and P. Mishra, Journal of Chemistry 2015 (2015) 1-12.